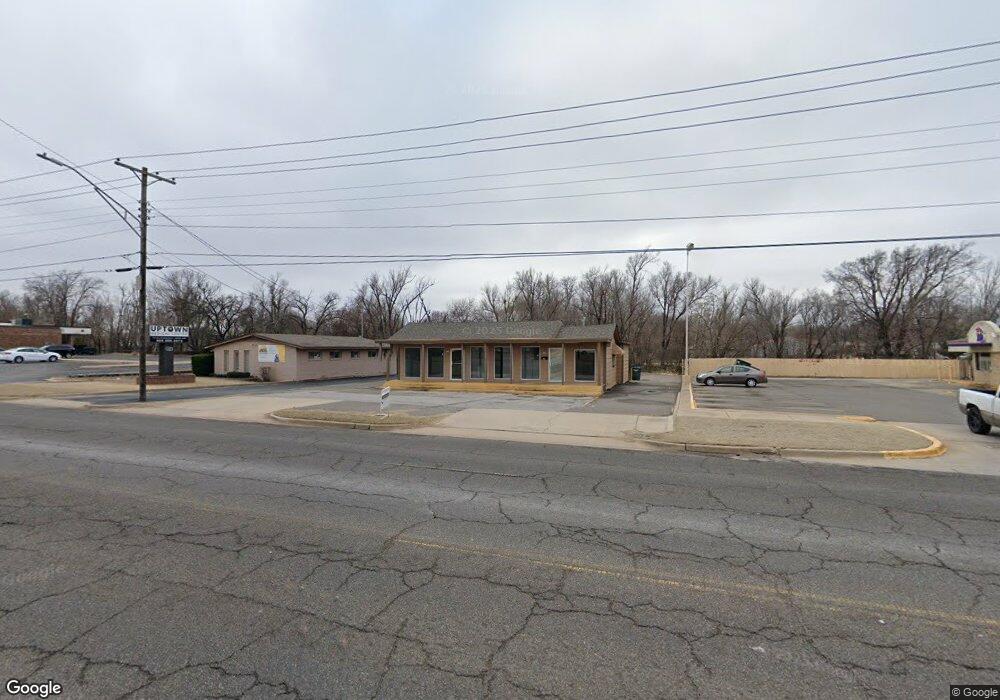
1205 S Sunnylane Rd Del City, OK 73115
Estimated Value: $166,534
--
Bed
--
Bath
1,255
Sq Ft
$133/Sq Ft
Est. Value
About This Home
This home is located at 1205 S Sunnylane Rd, Del City, OK 73115 and is currently estimated at $166,534, approximately $132 per square foot. 1205 S Sunnylane Rd is a home located in Oklahoma County with nearby schools including Del City Elementary School, Del City High School, and Christian Heritage Academy.
Ownership History
Date
Name
Owned For
Owner Type
Purchase Details
Closed on
Oct 2, 2025
Sold by
Ep & Sg Enterprises Llc
Bought by
Patterson Mark and Guest Jimmy O
Current Estimated Value
Purchase Details
Closed on
Aug 14, 2023
Sold by
Berry Katharine A Guest
Bought by
Ep & Sg Enterprises Inc
Purchase Details
Closed on
Jul 2, 2012
Sold by
Luu Thi Louise Vo Same Vo and Nguyen Bill T
Bought by
Cates Jeanie K
Purchase Details
Closed on
Jun 25, 2012
Sold by
Nguyen Richard
Bought by
Vo Louise and Thi Vo Lou
Purchase Details
Closed on
Mar 20, 2012
Sold by
Nguyen Richard
Bought by
Thi Louise Vo Same Vo Luu
Purchase Details
Closed on
Jan 15, 2009
Sold by
Vo Louise
Bought by
Nguyen Richard
Purchase Details
Closed on
Feb 27, 2002
Sold by
Campbell Robert Ross and The Iva Viola Campbell Medina
Bought by
Vo Louise L
Create a Home Valuation Report for This Property
The Home Valuation Report is an in-depth analysis detailing your home's value as well as a comparison with similar homes in the area
Home Values in the Area
Average Home Value in this Area
Purchase History
| Date | Buyer | Sale Price | Title Company |
|---|---|---|---|
| Patterson Mark | $125,000 | None Listed On Document | |
| Ep & Sg Enterprises Inc | $120,000 | None Listed On Document | |
| Cates Jeanie K | $82,000 | None Available | |
| Vo Louise | -- | None Available | |
| Thi Louise Vo Same Vo Luu | -- | None Available | |
| Nguyen Richard | -- | None Available | |
| Vo Louise L | $57,500 | American Guaranty Title Co |
Source: Public Records
Tax History Compared to Growth
Tax History
| Year | Tax Paid | Tax Assessment Tax Assessment Total Assessment is a certain percentage of the fair market value that is determined by local assessors to be the total taxable value of land and additions on the property. | Land | Improvement |
|---|---|---|---|---|
| 2024 | $1,546 | $13,749 | $3,465 | $10,284 |
| 2023 | $1,546 | $13,749 | $3,465 | $10,284 |
| 2022 | $1,523 | $13,749 | $3,465 | $10,284 |
| 2021 | $1,202 | $10,483 | $2,764 | $7,719 |
| 2020 | $1,176 | $9,984 | $2,632 | $7,352 |
| 2019 | $1,086 | $9,508 | $3,465 | $6,043 |
| 2018 | $1,101 | $9,509 | $0 | $0 |
| 2017 | $1,109 | $9,508 | $3,465 | $6,043 |
| 2016 | $1,123 | $9,365 | $3,465 | $5,900 |
| 2015 | $1,129 | $9,365 | $3,465 | $5,900 |
| 2014 | $1,126 | $9,365 | $3,465 | $5,900 |
Source: Public Records
Map
Nearby Homes
- 4108 SE 10th St
- 4316 SE 13th St
- 4109 SE 14th St
- 4345 Woodedge Dr
- 1645 Lariet Ln
- 1608 Hanna Dr
- 3724 SE 15th St
- 3921 SE 11th St
- 3924 SE 14th St
- 1600 Elm Dr
- 3918 SE 12th St
- 3917 SE 12th St
- 3919 SE 10th Place
- 720 Del Haven Dr
- 3902 SE 14th St
- 3336 Longridge Rd
- 1137 Mallard Dr
- 1021 Vickie Dr
- 3316 Beechwood Dr
- 1812 Lariet Ln
- 1207 S Sunnylane Rd
- 4111 SE 12th St
- 4301 SE 12th St
- 4108 SE 11th St
- 4300 SE 12th St
- 4109 SE 12th St
- 4300 Woodedge Dr
- 4305 SE 12th St
- 4111 SE 11th St
- 4106 SE 11th St
- 4304 Woodedge Dr
- 4107 SE 12th St
- 4304 SE 12th St
- 4301 SE 13th St
- 4309 SE 12th St
- 4109 SE 11th St
- 4110 SE 12th St
- 4308 Woodedge Dr
- 1101 S Sunnylane Rd
- 4105 SE 12th St