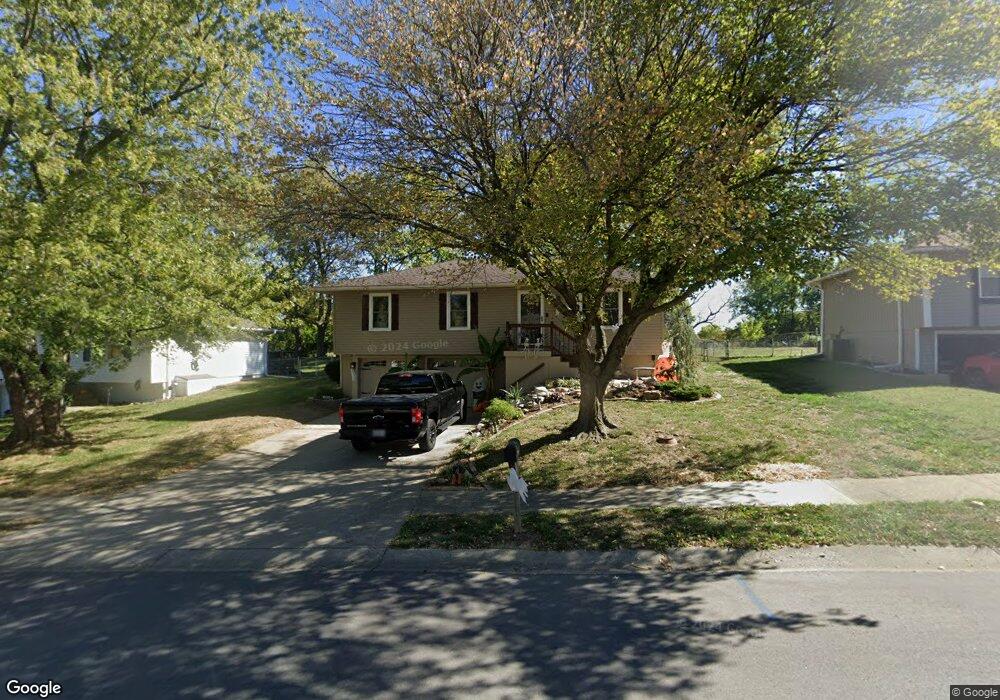
1205 SE Royal St Oak Grove, MO 64075
Estimated Value: $232,000 - $244,192
3
Beds
1
Bath
1,054
Sq Ft
$224/Sq Ft
Est. Value
About This Home
This home is located at 1205 SE Royal St, Oak Grove, MO 64075 and is currently estimated at $236,048, approximately $223 per square foot. 1205 SE Royal St is a home located in Jackson County with nearby schools including Oak Grove Primary School, Oak Grove Elementary School, and Oak Grove Middle School.
Ownership History
Date
Name
Owned For
Owner Type
Purchase Details
Closed on
Mar 31, 2005
Sold by
Stinnett Christopher D and Stinnett Misty D
Bought by
Stinnett Christopher D and Stinnett Misty D
Current Estimated Value
Home Financials for this Owner
Home Financials are based on the most recent Mortgage that was taken out on this home.
Original Mortgage
$20,166
Outstanding Balance
$5,934
Interest Rate
5.75%
Mortgage Type
Credit Line Revolving
Estimated Equity
$230,114
Purchase Details
Closed on
Sep 18, 1997
Sold by
Thomas James M and Thomas Katherine
Bought by
Stinnett Christopher D and Curtis Misty D
Home Financials for this Owner
Home Financials are based on the most recent Mortgage that was taken out on this home.
Original Mortgage
$73,211
Outstanding Balance
$11,356
Interest Rate
7.48%
Mortgage Type
FHA
Estimated Equity
$224,692
Create a Home Valuation Report for This Property
The Home Valuation Report is an in-depth analysis detailing your home's value as well as a comparison with similar homes in the area
Home Values in the Area
Average Home Value in this Area
Purchase History
| Date | Buyer | Sale Price | Title Company |
|---|---|---|---|
| Stinnett Christopher D | -- | Stewart Title Of Ks City Inc | |
| Stinnett Christopher D | -- | Old Republic Title Company |
Source: Public Records
Mortgage History
| Date | Status | Borrower | Loan Amount |
|---|---|---|---|
| Open | Stinnett Christopher D | $20,166 | |
| Open | Stinnett Christopher D | $73,211 |
Source: Public Records
Tax History Compared to Growth
Tax History
| Year | Tax Paid | Tax Assessment Tax Assessment Total Assessment is a certain percentage of the fair market value that is determined by local assessors to be the total taxable value of land and additions on the property. | Land | Improvement |
|---|---|---|---|---|
| 2025 | $2,790 | $31,910 | $4,102 | $27,808 |
| 2024 | $2,763 | $35,908 | $4,051 | $31,857 |
| 2023 | $2,763 | $35,908 | $4,345 | $31,563 |
| 2022 | $2,034 | $24,130 | $3,658 | $20,472 |
| 2021 | $1,990 | $24,130 | $3,658 | $20,472 |
| 2020 | $1,938 | $22,892 | $3,658 | $19,234 |
| 2019 | $1,843 | $22,892 | $3,658 | $19,234 |
| 2018 | $1,600 | $20,852 | $3,456 | $17,396 |
| 2017 | $1,609 | $20,852 | $3,456 | $17,396 |
| 2016 | $1,609 | $20,330 | $2,983 | $17,347 |
| 2014 | $1,446 | $18,218 | $2,982 | $15,236 |
Source: Public Records
Map
Nearby Homes
- 1407 SE Hillside Dr
- 1604 SE Kingsway St
- 1106 SE Chelsey Ln
- 801 SE 13th St
- 1108 SE Oak Ridge Dr
- 508 SE 12th St
- TBD SE Horseshoe Dr
- 809 SE 19th St
- 2305 SE Horseshoe Dr
- 0 Fulks Rd
- 2004 SE Oak Ridge Dr
- 704 SE 21st St
- 612 SE 21st St
- 509 SE 20th St
- 2112 SE Oak Ridge Dr
- 2200 SE Oak Ridge Dr
- 701 SE 21st St
- 1312 SW Clinton St
- 704 SW Clinton St
- 1705 Locust St
- 1207 SE Royal St
- 1203 SE Royal St
- 1401 SE Royal St
- 1201 SE Royal St
- 1202 SE Royal St
- 28 SE Golden Belt Rd
- 1400 SE Queens Ct
- 1403 SE Royal St
- 1200 SE Royal St
- 1405 SE Royal St
- 1302 SE Queens Ct
- 1604 SE 15th Place
- 1305 SE Queens Ct
- 1604 SE 15th Street Place
- 1304 SE Queens Ct
- 1407 SE Royal St
- 1306 SE Queens Ct
- 1602 SE 15th Place
- 1305 SE Knight Cir
- 1501 SE Royal St