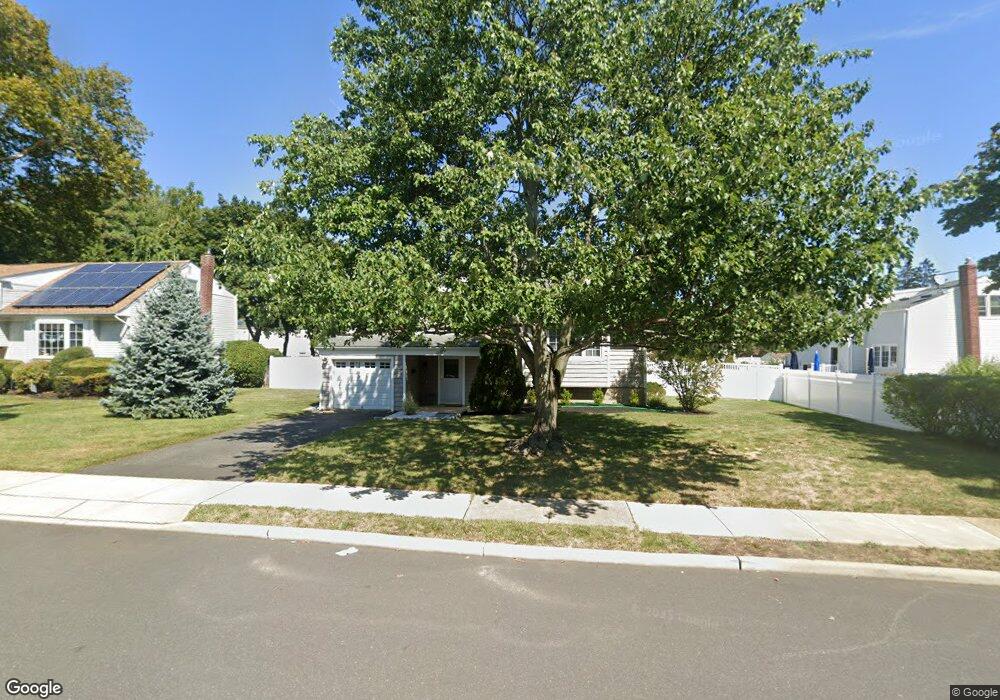
1205 Turf Dr Oceanport, NJ 07757
Estimated Value: $597,000 - $800,000
4
Beds
2
Baths
1,895
Sq Ft
$376/Sq Ft
Est. Value
About This Home
This home is located at 1205 Turf Dr, Oceanport, NJ 07757 and is currently estimated at $712,482, approximately $375 per square foot. 1205 Turf Dr is a home located in Monmouth County with nearby schools including Wolf Hill Elementary School, Maple Place Elementary and Middle School, and Shore Regional High School.
Ownership History
Date
Name
Owned For
Owner Type
Purchase Details
Closed on
Nov 10, 2022
Sold by
Mckelvey Margaret M
Bought by
Mckelvey John and Orona Alexandria B
Current Estimated Value
Home Financials for this Owner
Home Financials are based on the most recent Mortgage that was taken out on this home.
Original Mortgage
$498,750
Outstanding Balance
$483,256
Interest Rate
6.94%
Mortgage Type
New Conventional
Estimated Equity
$229,226
Create a Home Valuation Report for This Property
The Home Valuation Report is an in-depth analysis detailing your home's value as well as a comparison with similar homes in the area
Home Values in the Area
Average Home Value in this Area
Purchase History
| Date | Buyer | Sale Price | Title Company |
|---|---|---|---|
| Mckelvey John | $525,000 | Trident Abstract Title | |
| Mckelvey John | $525,000 | Trident Abstract Title |
Source: Public Records
Mortgage History
| Date | Status | Borrower | Loan Amount |
|---|---|---|---|
| Open | Mckelvey John | $498,750 | |
| Closed | Mckelvey John | $498,750 |
Source: Public Records
Tax History
| Year | Tax Paid | Tax Assessment Tax Assessment Total Assessment is a certain percentage of the fair market value that is determined by local assessors to be the total taxable value of land and additions on the property. | Land | Improvement |
|---|---|---|---|---|
| 2025 | $8,290 | $556,100 | $346,700 | $209,400 |
| 2024 | $7,734 | $525,000 | $324,700 | $200,300 |
| 2023 | $7,734 | $464,800 | $284,700 | $180,100 |
| 2022 | $7,725 | $423,300 | $264,700 | $158,600 |
| 2021 | $7,725 | $405,500 | $254,700 | $150,800 |
| 2020 | $7,219 | $394,900 | $246,700 | $148,200 |
| 2019 | $6,840 | $379,800 | $236,700 | $143,100 |
| 2018 | $7,049 | $394,000 | $236,700 | $157,300 |
| 2017 | $6,516 | $302,100 | $158,100 | $144,000 |
| 2016 | $6,545 | $305,400 | $164,100 | $141,300 |
| 2015 | $6,111 | $306,700 | $169,100 | $137,600 |
| 2014 | $6,012 | $306,200 | $184,100 | $122,100 |
Source: Public Records
Map
Nearby Homes
- 15 Maple Ave
- 24 Burntmill Cir
- 58 Monmouth Rd
- 25 Monmouth Rd Unit 2
- 8 Hialeah
- 37 Steeplechase Ct
- 14 Oceanport Ave
- 66 Pemberton Ave
- 185 Monmouth Rd
- 28 Fairfield Ave
- 53 Arlene Dr
- 113 Parker Rd
- 74 Reynolds Dr
- 940 Broadway
- 3 Woods Rd
- 1 Cambridge Ct
- 3 Carrington Dr
- 29 Village Dr
- 265 Port Au Peck Ave
- 0 Elkwood Ave
Your Personal Tour Guide
Ask me questions while you tour the home.