12050 Maxim Way Cincinnati, OH 45249
Highpoint NeighborhoodEstimated Value: $293,988 - $313,000
3
Beds
2
Baths
1,445
Sq Ft
$210/Sq Ft
Est. Value
About This Home
This home is located at 12050 Maxim Way, Cincinnati, OH 45249 and is currently estimated at $303,997, approximately $210 per square foot. 12050 Maxim Way is a home located in Hamilton County with nearby schools including Edwin H Greene Intermediate Middle School, Sycamore Junior High School, and Sycamore High School.
Ownership History
Date
Name
Owned For
Owner Type
Purchase Details
Closed on
Oct 1, 2014
Sold by
Snider Scott P and Snider Julie K
Bought by
Pjtb Llc
Current Estimated Value
Purchase Details
Closed on
Feb 28, 2003
Sold by
Npv Investors Llc
Bought by
Snider Scott P
Purchase Details
Closed on
Jun 7, 2002
Sold by
Npv Investors Llc
Bought by
Snider Scott
Home Financials for this Owner
Home Financials are based on the most recent Mortgage that was taken out on this home.
Original Mortgage
$246,158
Interest Rate
5.94%
Mortgage Type
Seller Take Back
Purchase Details
Closed on
Sep 29, 1999
Sold by
Royale Point Ltd
Bought by
Npv Investors Llc
Home Financials for this Owner
Home Financials are based on the most recent Mortgage that was taken out on this home.
Original Mortgage
$486,800
Interest Rate
8.25%
Create a Home Valuation Report for This Property
The Home Valuation Report is an in-depth analysis detailing your home's value as well as a comparison with similar homes in the area
Home Values in the Area
Average Home Value in this Area
Purchase History
| Date | Buyer | Sale Price | Title Company |
|---|---|---|---|
| Pjtb Llc | -- | Attorney | |
| Snider Scott P | $156,000 | -- | |
| Snider Scott | $312,000 | -- | |
| Npv Investors Llc | $608,600 | Tri-Star Title Agency Inc |
Source: Public Records
Mortgage History
| Date | Status | Borrower | Loan Amount |
|---|---|---|---|
| Previous Owner | Snider Scott | $246,158 | |
| Previous Owner | Npv Investors Llc | $486,800 |
Source: Public Records
Tax History Compared to Growth
Tax History
| Year | Tax Paid | Tax Assessment Tax Assessment Total Assessment is a certain percentage of the fair market value that is determined by local assessors to be the total taxable value of land and additions on the property. | Land | Improvement |
|---|---|---|---|---|
| 2024 | $4,283 | $84,130 | $14,210 | $69,920 |
| 2023 | $4,191 | $84,130 | $14,210 | $69,920 |
| 2022 | $3,511 | $57,442 | $11,368 | $46,074 |
| 2021 | $3,504 | $57,442 | $11,368 | $46,074 |
| 2020 | $3,458 | $57,442 | $11,368 | $46,074 |
| 2019 | $3,122 | $49,518 | $9,800 | $39,718 |
| 2018 | $3,004 | $49,518 | $9,800 | $39,718 |
| 2017 | $2,855 | $49,518 | $9,800 | $39,718 |
| 2016 | $3,068 | $50,715 | $12,250 | $38,465 |
| 2015 | $2,597 | $50,715 | $12,250 | $38,465 |
| 2014 | $2,579 | $50,715 | $12,250 | $38,465 |
| 2013 | $2,658 | $50,715 | $12,250 | $38,465 |
Source: Public Records
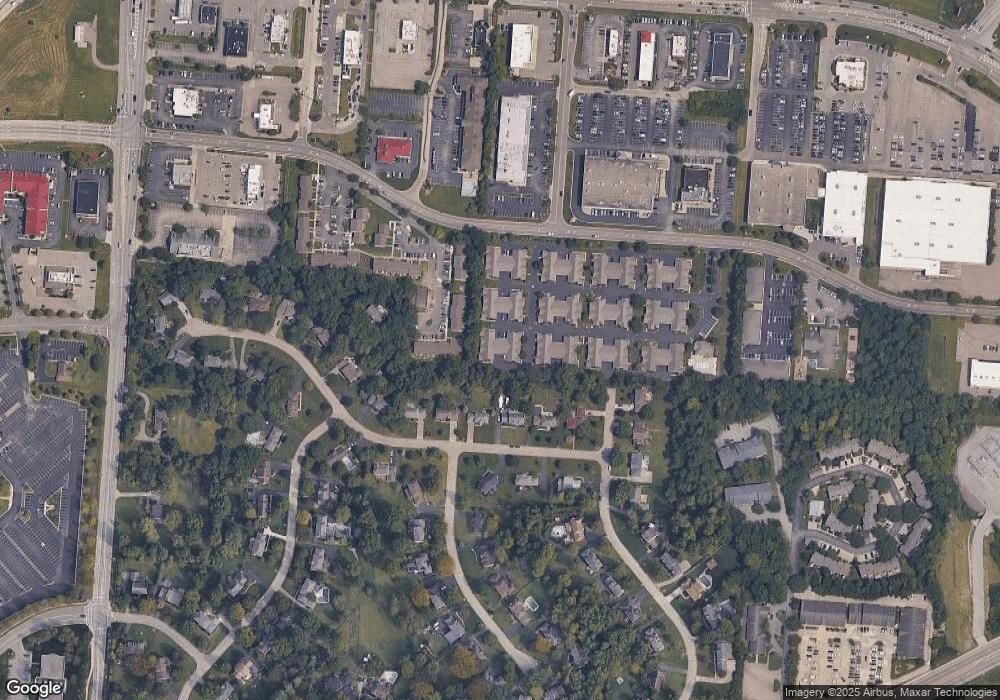
Map
Nearby Homes
- 8936 Cypresspoint Ln
- 11971 Olde Dominion Dr Unit 7
- 12016 Mason Rd
- 9141 Dominion Cir
- 9130 Dominion Cir
- 9160 Symmes Landing Dr
- 11724 Gable Glen Ln
- 11730 Gable Glen Ln
- 11722 Gable Glen Ln
- 11782 Gable Glen Ln
- 11659 Symmes Valley Dr
- 11783 Gable Glen Ln
- 220 Carrington Ln
- 210 Carrington Ln
- 11811 Vaukvalley Ln
- 11807 Vaukvalley Ln
- 710 Carrington Place
- 12091 Carrington Ln
- 210 Carrington Place
- 12056 Maxim Way
- 12054 Maxim Way Unit 12054
- 12052 Maxim Way
- 12046 Maxim Way Unit 12046
- 12044 Maxim Way Unit 12044
- 12042 Maxim Way
- 12063 Maxim Way
- 9012 Cypresspoint Ln
- 9024 Cypresspoint Ln
- 9000 Cypresspoint Ln
- 9036 Cypresspoint Ln
- 12032 Maxim Way Unit 12032
- 12030 Maxim Way Unit 12030
- 12036 Maxim Way Unit 12036
- 12021 Maxim Way
- 12022 Maxim Way
- 12022 Maxim Way Unit 7B
- 12034 Maxim Way
- 12034 Maxim Way Unit 12034
- 12026 Maxim Way