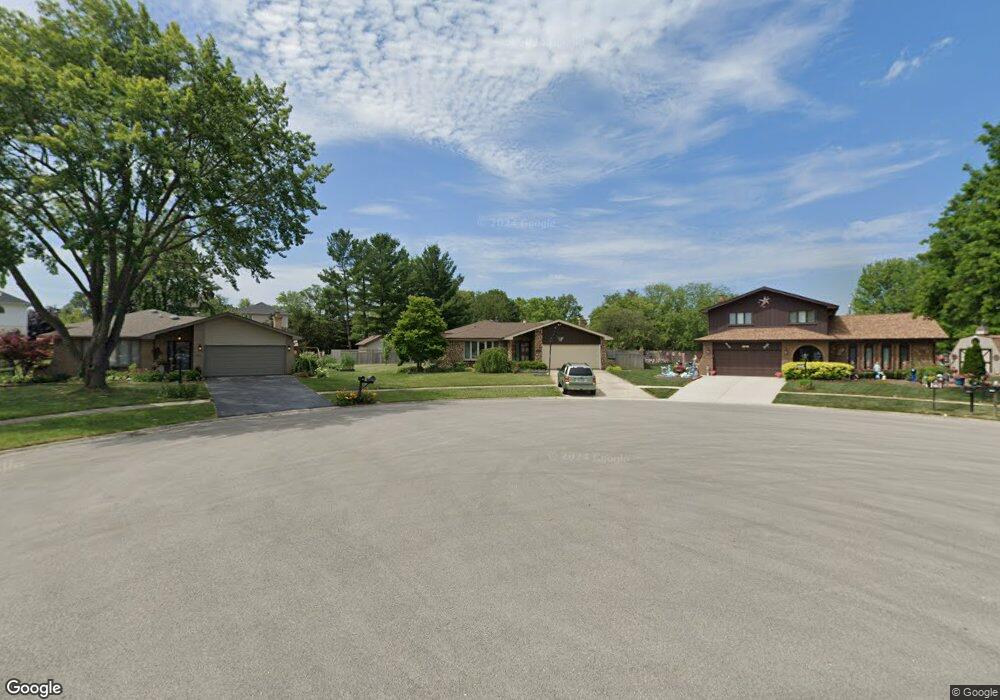
12053 Meadowland Dr Homer Glen, IL 60491
Estimated Value: $380,018 - $442,000
3
Beds
--
Bath
1,813
Sq Ft
$229/Sq Ft
Est. Value
About This Home
This home is located at 12053 Meadowland Dr, Homer Glen, IL 60491 and is currently estimated at $415,255, approximately $229 per square foot. 12053 Meadowland Dr is a home located in Will County with nearby schools including Goodings Grove School, Hadley Middle School, and Homer Jr High School.
Ownership History
Date
Name
Owned For
Owner Type
Purchase Details
Closed on
May 26, 2004
Sold by
Zander Mark A and Zander Sonja
Bought by
Paller Louis J and Paller Ellen M
Current Estimated Value
Home Financials for this Owner
Home Financials are based on the most recent Mortgage that was taken out on this home.
Original Mortgage
$200,000
Outstanding Balance
$97,702
Interest Rate
5.99%
Mortgage Type
Purchase Money Mortgage
Estimated Equity
$317,553
Purchase Details
Closed on
Sep 21, 1998
Sold by
Zander Sonja
Bought by
Zander Mark A and Zander Zonja
Home Financials for this Owner
Home Financials are based on the most recent Mortgage that was taken out on this home.
Original Mortgage
$71,000
Interest Rate
6.99%
Purchase Details
Closed on
May 16, 1996
Sold by
Zander Mark A
Bought by
Zander Sonja
Purchase Details
Closed on
Dec 16, 1993
Sold by
Zander Janet
Bought by
Zander Mark A
Create a Home Valuation Report for This Property
The Home Valuation Report is an in-depth analysis detailing your home's value as well as a comparison with similar homes in the area
Home Values in the Area
Average Home Value in this Area
Purchase History
| Date | Buyer | Sale Price | Title Company |
|---|---|---|---|
| Paller Louis J | $268,500 | Multiple | |
| Zander Mark A | -- | Chicago Title Insurance Co | |
| Zander Sonja | -- | -- | |
| Zander Mark A | -- | Mid America Title Company |
Source: Public Records
Mortgage History
| Date | Status | Borrower | Loan Amount |
|---|---|---|---|
| Open | Paller Louis J | $200,000 | |
| Previous Owner | Zander Mark A | $71,000 |
Source: Public Records
Tax History Compared to Growth
Tax History
| Year | Tax Paid | Tax Assessment Tax Assessment Total Assessment is a certain percentage of the fair market value that is determined by local assessors to be the total taxable value of land and additions on the property. | Land | Improvement |
|---|---|---|---|---|
| 2024 | $7,919 | $117,075 | $21,398 | $95,677 |
| 2023 | $7,919 | $106,123 | $19,396 | $86,727 |
| 2022 | $7,253 | $99,088 | $18,110 | $80,978 |
| 2021 | $6,901 | $93,878 | $17,158 | $76,720 |
| 2020 | $6,918 | $90,424 | $16,527 | $73,897 |
| 2019 | $6,588 | $86,988 | $15,899 | $71,089 |
| 2018 | $6,218 | $81,537 | $15,717 | $65,820 |
| 2017 | $6,100 | $79,254 | $15,277 | $63,977 |
| 2016 | $5,946 | $76,611 | $14,768 | $61,843 |
| 2015 | $5,694 | $73,736 | $14,214 | $59,522 |
| 2014 | $5,694 | $72,212 | $13,920 | $58,292 |
| 2013 | $5,694 | $72,212 | $13,920 | $58,292 |
Source: Public Records
Map
Nearby Homes
- 14405 Creekwood Dr
- 14533 Mallard Dr
- 14225 Mallard Dr
- 14328 Pinewood Dr
- 11901 Windemere Ct Unit 301
- 11851 Windemere Ct Unit 201
- 11901 Somerset Rd Unit 2
- 11501 W 143rd St
- 11701 Waters Edge Trail
- 11637 Brookview Ln
- 14124 Pheasant Ln
- 12360 Derby Ln
- 14467 Creekview Dr
- 14561 S Appaloosa Ln
- 87 Windmill Rd
- 14042 Churchill Dr
- Fremont Plan at Goodings Grove
- Eden Plan at Goodings Grove
- Danbury Plan at Goodings Grove
- Calysta Plan at Goodings Grove
- 12055 Meadowland Dr
- 12049 Meadowland Dr
- 14501 S Abbott Rd E
- 14463 S Abbott Rd E
- 12045 Flint Dr
- 12041 Flint Dr
- 12041 Meadowland Dr
- 14511 S Abbott Rd E
- 12057 Meadowland Dr
- 12049 Flint Dr
- 14459 S Abbott Rd E
- 12105 Meadowland Dr
- 12033 Meadowland Dr
- 12111 Meadowland Dr
- 12053 Flint Dr
- 12045 Meadowland Dr
- 12037 Flint Dr
- 14455 S Abbott Rd E
- 12034 Meadowland Dr
- 14527 S Abbott Rd E