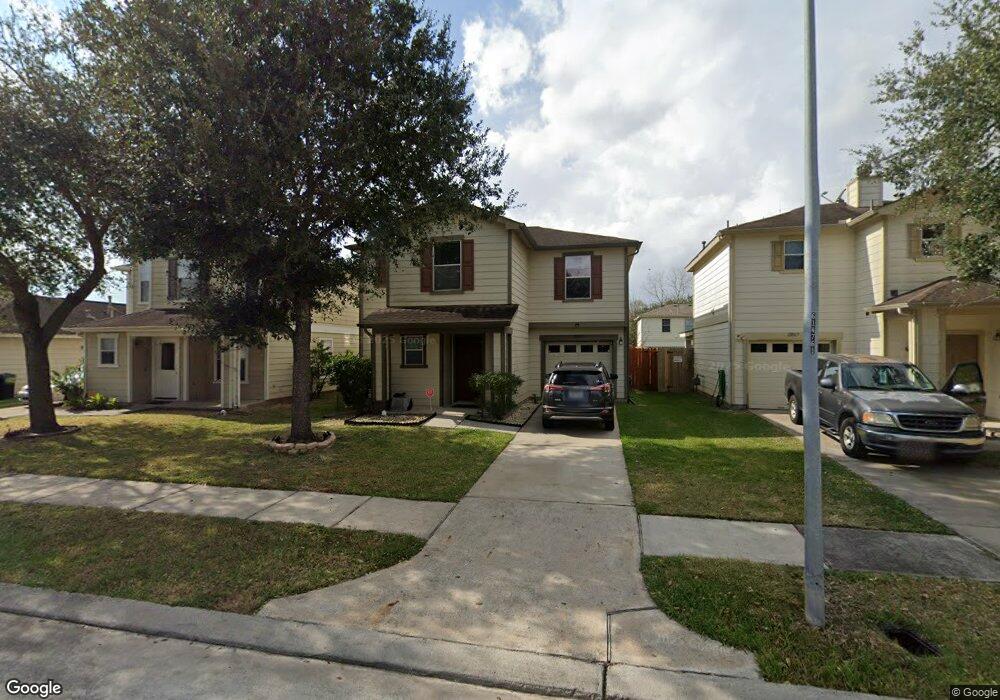
12059 Mallard Stream St Houston, TX 77038
North Houston NeighborhoodEstimated Value: $223,038 - $246,000
4
Beds
3
Baths
1,955
Sq Ft
$120/Sq Ft
Est. Value
About This Home
This home is located at 12059 Mallard Stream St, Houston, TX 77038 and is currently estimated at $235,260, approximately $120 per square foot. 12059 Mallard Stream St is a home located in Harris County with nearby schools including Kujawa EC/Pre-K/K School, Carter Academy, and Shotwell Middle School.
Ownership History
Date
Name
Owned For
Owner Type
Purchase Details
Closed on
Mar 20, 2018
Sold by
Pine Creek Property Managment Llc
Bought by
Barrios Sarah Yadira and Vallejo Hecior Hugo
Current Estimated Value
Home Financials for this Owner
Home Financials are based on the most recent Mortgage that was taken out on this home.
Original Mortgage
$143,355
Outstanding Balance
$125,924
Interest Rate
5.5%
Mortgage Type
FHA
Estimated Equity
$109,336
Purchase Details
Closed on
Jan 22, 2010
Sold by
Bank Of America National Association
Bought by
Nguyen Thu Huong and Nguyen Hanh D
Purchase Details
Closed on
Mar 9, 2006
Sold by
Kb Home Lone Star Lp
Bought by
Olvera Tomas
Home Financials for this Owner
Home Financials are based on the most recent Mortgage that was taken out on this home.
Original Mortgage
$85,596
Interest Rate
9.2%
Mortgage Type
Fannie Mae Freddie Mac
Create a Home Valuation Report for This Property
The Home Valuation Report is an in-depth analysis detailing your home's value as well as a comparison with similar homes in the area
Home Values in the Area
Average Home Value in this Area
Purchase History
| Date | Buyer | Sale Price | Title Company |
|---|---|---|---|
| Barrios Sarah Yadira | -- | Frontier Title Company Wh Ll | |
| Nguyen Thu Huong | -- | Fidelity National Title | |
| Olvera Tomas | -- | First American Title |
Source: Public Records
Mortgage History
| Date | Status | Borrower | Loan Amount |
|---|---|---|---|
| Open | Barrios Sarah Yadira | $143,355 | |
| Previous Owner | Olvera Tomas | $85,596 |
Source: Public Records
Tax History Compared to Growth
Tax History
| Year | Tax Paid | Tax Assessment Tax Assessment Total Assessment is a certain percentage of the fair market value that is determined by local assessors to be the total taxable value of land and additions on the property. | Land | Improvement |
|---|---|---|---|---|
| 2025 | $5,247 | $224,525 | $43,560 | $180,965 |
| 2024 | $5,247 | $224,525 | $43,560 | $180,965 |
| 2023 | $5,247 | $225,490 | $43,560 | $181,930 |
| 2022 | $5,934 | $197,459 | $26,400 | $171,059 |
| 2021 | $5,604 | $166,094 | $26,400 | $139,694 |
| 2020 | $5,266 | $150,346 | $26,400 | $123,946 |
| 2019 | $4,931 | $134,039 | $19,800 | $114,239 |
| 2018 | $1,806 | $125,802 | $19,800 | $106,002 |
| 2017 | $4,487 | $125,802 | $19,800 | $106,002 |
| 2016 | $4,273 | $119,809 | $19,800 | $100,009 |
| 2015 | $3,328 | $105,304 | $19,800 | $85,504 |
| 2014 | $3,328 | $94,276 | $19,800 | $74,476 |
Source: Public Records
Map
Nearby Homes
- 12042 Mallard Stream Ct
- 12015 Audubon Hill Ct
- 12026 Madison Oak St
- 12006 Mallard Stream Ct
- 12007 Bach Orchard Trail
- 2934 Valiant Scene Ct
- 2907 Valiant Scene Ct
- 2702 Urban Glen Ct
- 2743 Oriole Wood Ct
- 2746 Piney Lake Ct
- 11707 Madison Oak St
- 11726 Wren Crossing Dr
- 12518 Pelican Bay Dr
- 2610 Cabin Cove Ln
- 2606 Oakwood Bluff Trail
- 2631 Palmetto Valley Dr
- Whitetail Plan at Forestwood
- Kitson Plan at Forestwood
- Pinehollow Plan at Forestwood
- 12530 Wild Strawberry Rd
- 12055 Mallard Stream St
- 12063 Mallard Stream St
- 12063 Mallard Stream Ct
- 12051 Mallard Stream St
- 12067 Mallard Stream St
- 12058 Madison Oak St
- 12054 Madison Oak St
- 12062 Madison Oak St
- 12047 Mallard Stream St
- 12050 Madison Oak St
- 12066 Madison Oak St
- 12043 Mallard Stream St
- 12046 Madison Oak St
- 12054 Mallard Stream Ct
- 12058 Mallard Stream St
- 12062 Mallard Stream St
- 12054 Mallard Stream St
- 2922 Paddock Brook Ln
- 12050 Mallard Stream Ct
- 12050 Mallard Stream St