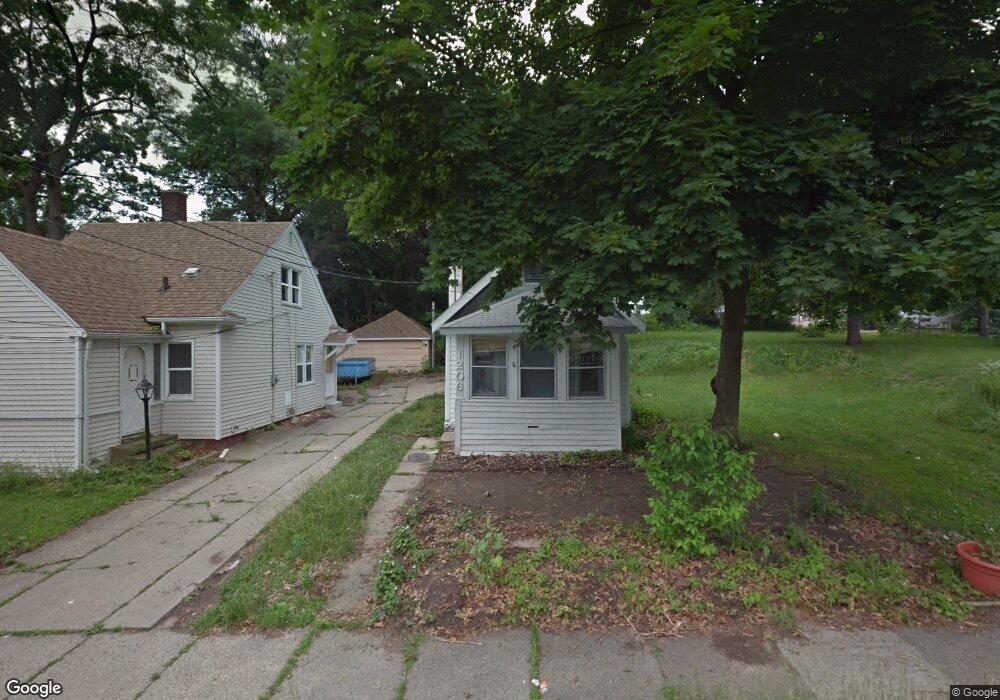
1206 Allen St Lansing, MI 48912
Potter Walsh NeighborhoodEstimated Value: $71,341 - $106,000
--
Bed
--
Bath
821
Sq Ft
$106/Sq Ft
Est. Value
About This Home
This home is located at 1206 Allen St, Lansing, MI 48912 and is currently estimated at $86,835, approximately $105 per square foot. 1206 Allen St is a home located in Ingham County with nearby schools including Pattengill Academy, Lyons Elementary School, and Eastern High School.
Ownership History
Date
Name
Owned For
Owner Type
Purchase Details
Closed on
Sep 25, 2015
Sold by
Sheets David W
Bought by
D W Sheets Ii Llc
Current Estimated Value
Purchase Details
Closed on
Sep 12, 2014
Sold by
Schertzing Eric
Bought by
David W Sheets Rev Trust
Purchase Details
Closed on
Jul 21, 1999
Sold by
Burnett Jan R and Burnett Cindy L
Bought by
Vanetten Kenneth F and Vanetten Evelyn A
Home Financials for this Owner
Home Financials are based on the most recent Mortgage that was taken out on this home.
Original Mortgage
$28,800
Interest Rate
7.77%
Mortgage Type
Purchase Money Mortgage
Purchase Details
Closed on
Jan 18, 1996
Sold by
Burnett Jan R and Burnett Cindy L
Purchase Details
Closed on
Feb 26, 1987
Sold by
Burnett George E and Burnett Louise M
Bought by
Burnett Jan R and Burnett Cindy L
Create a Home Valuation Report for This Property
The Home Valuation Report is an in-depth analysis detailing your home's value as well as a comparison with similar homes in the area
Home Values in the Area
Average Home Value in this Area
Purchase History
| Date | Buyer | Sale Price | Title Company |
|---|---|---|---|
| D W Sheets Ii Llc | -- | None Available | |
| David W Sheets Rev Trust | $52,063 | None Available | |
| Vanetten Kenneth F | $27,000 | -- | |
| -- | -- | -- | |
| Burnett Jan R | $30,000 | -- |
Source: Public Records
Mortgage History
| Date | Status | Borrower | Loan Amount |
|---|---|---|---|
| Previous Owner | Vanetten Kenneth F | $28,800 |
Source: Public Records
Tax History Compared to Growth
Tax History
| Year | Tax Paid | Tax Assessment Tax Assessment Total Assessment is a certain percentage of the fair market value that is determined by local assessors to be the total taxable value of land and additions on the property. | Land | Improvement |
|---|---|---|---|---|
| 2025 | $1,685 | $34,600 | $2,700 | $31,900 |
| 2024 | $13 | $29,200 | $2,700 | $26,500 |
| 2023 | $1,588 | $25,200 | $2,700 | $22,500 |
| 2022 | $1,453 | $22,200 | $2,400 | $19,800 |
| 2021 | $1,420 | $19,700 | $2,600 | $17,100 |
| 2020 | $1,409 | $19,100 | $2,600 | $16,500 |
| 2019 | $1,359 | $18,600 | $2,600 | $16,000 |
| 2018 | $1,291 | $16,100 | $2,600 | $13,500 |
| 2017 | $1,241 | $16,100 | $2,600 | $13,500 |
| 2016 | $2,669 | $15,800 | $2,600 | $13,200 |
| 2015 | $2,669 | $15,500 | $5,217 | $10,283 |
| 2014 | $2,669 | $15,500 | $3,913 | $11,587 |
Source: Public Records
Map
Nearby Homes
- 1204 Shepard St
- 1128 Lathrop St
- 1225 Regent St
- 1019 Dakin St
- 1200 S Holmes St
- 910 S Holmes St
- 1212 Climax St
- 607 Shepard St Unit 2
- 637 S Clemens Ave
- 701 S Fairview Ave
- 1201 Climax St
- 727 S Magnolia Ave
- 523 Clifford St
- 1620 Clifton Ave
- 1221 Pershing Dr
- 528 S Fairview Ave
- 517 S Clemens Ave
- 515 S Clemens Ave
- 624 S Hayford Ave
- 1423 Pontiac St