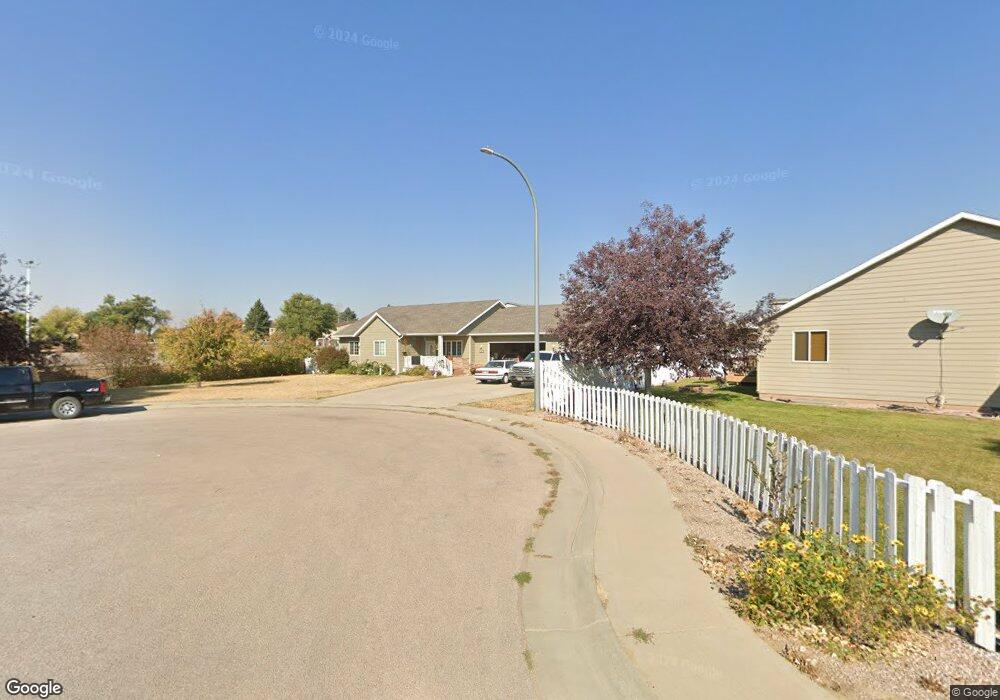
1206 Avalon Ct Gillette, WY 82716
Estimated Value: $190,000 - $349,000
3
Beds
3
Baths
2,728
Sq Ft
$110/Sq Ft
Est. Value
About This Home
This home is located at 1206 Avalon Ct, Gillette, WY 82716 and is currently estimated at $301,295, approximately $110 per square foot. 1206 Avalon Ct is a home located in Campbell County with nearby schools including Westwood High School, Hillcrest Elementary School, and Twin Spruce Junior High School.
Ownership History
Date
Name
Owned For
Owner Type
Purchase Details
Closed on
Nov 26, 2024
Sold by
Heying Duwayne and Heying Katherine
Bought by
Second Restatement Of The Nancy A Morgan Decl
Current Estimated Value
Purchase Details
Closed on
Jul 2, 2018
Sold by
Crowe Garth L and Crowe Rheaann
Bought by
Heying Duwayne and Heying Katherine
Purchase Details
Closed on
Aug 31, 2005
Sold by
West Justin and West John K
Bought by
Crowe Garth L and Crowe Rhea Ann
Home Financials for this Owner
Home Financials are based on the most recent Mortgage that was taken out on this home.
Original Mortgage
$139,266
Interest Rate
5.8%
Mortgage Type
New Conventional
Purchase Details
Closed on
Mar 25, 2005
Sold by
Providence Investors Group Llc
Bought by
West Justin and West John K
Create a Home Valuation Report for This Property
The Home Valuation Report is an in-depth analysis detailing your home's value as well as a comparison with similar homes in the area
Home Values in the Area
Average Home Value in this Area
Purchase History
| Date | Buyer | Sale Price | Title Company |
|---|---|---|---|
| Second Restatement Of The Nancy A Morgan Decl | -- | None Listed On Document | |
| Second Restatement Of The Nancy A Morgan Decl | -- | None Listed On Document | |
| Heying Duwayne | -- | None Available | |
| Crowe Garth L | -- | Stewart Title Company | |
| West Justin | -- | Stewart Title Company Of Gil |
Source: Public Records
Mortgage History
| Date | Status | Borrower | Loan Amount |
|---|---|---|---|
| Previous Owner | Crowe Garth L | $139,266 |
Source: Public Records
Tax History Compared to Growth
Tax History
| Year | Tax Paid | Tax Assessment Tax Assessment Total Assessment is a certain percentage of the fair market value that is determined by local assessors to be the total taxable value of land and additions on the property. | Land | Improvement |
|---|---|---|---|---|
| 2025 | $1,827 | $24,660 | $5,260 | $19,400 |
| 2024 | $1,827 | $28,985 | $5,844 | $23,141 |
| 2023 | $1,901 | $30,020 | $6,774 | $23,246 |
| 2022 | $1,606 | $25,758 | $6,299 | $19,459 |
| 2021 | $1,380 | $23,230 | $5,349 | $17,881 |
| 2020 | $1,383 | $23,319 | $5,349 | $17,970 |
| 2019 | $1,247 | $21,368 | $5,349 | $16,019 |
| 2018 | $1,387 | $20,520 | $5,349 | $15,171 |
| 2017 | $1,424 | $21,100 | $4,750 | $16,350 |
| 2016 | $1,512 | $22,384 | $4,988 | $17,396 |
| 2015 | -- | $21,932 | $4,988 | $16,944 |
| 2014 | -- | $21,689 | $4,988 | $16,701 |
Source: Public Records
Map
Nearby Homes
- 210 Overland Trail
- 913 A&B E 12th St
- 1041 Teton Cir
- 1603 Monte Vista Ln
- 1033 Santee Dr
- 1028 E 9th St
- 905 S Gurley Ave
- 102 Overland Trail
- 1706 Monte Vista Ln
- 1137 Boxelder Rd
- 1122 Boxelder Rd
- 1116 Boxelder Rd
- 4155 Butler-Spaeth Rd
- 1285 Country Club Rd
- 9 Highland Ct
- 814 E 3rd St
- 821 Madison St
- 700 S Brooks Ave
- 480 Boxelder Rd
- 409 S Emerson Ave
- 1200 Providence Ln
- 1202 Providence Ln
- 1208 Avalon Ct
- 1210 Avalon Ct
- 1106 Church Ave
- 1214 Providence Ln
- 1203 Providence Ln -
- 1201 Providence Ln
- 1203 Providence Ln
- 1303 E 12th St
- 1303-1307 Twelfth St E
- 1205 Providence Ln
- 1300 Providence Ln
- 1309 Eagles Nest Cir
- 1311 Eagles Nest Cir
- 1313 Eagles Nest Cir
- 1102 Stanley Ave
- 1315 Eagles Nest Cir
- 1305 E 12th St
- 1307 E 12th St