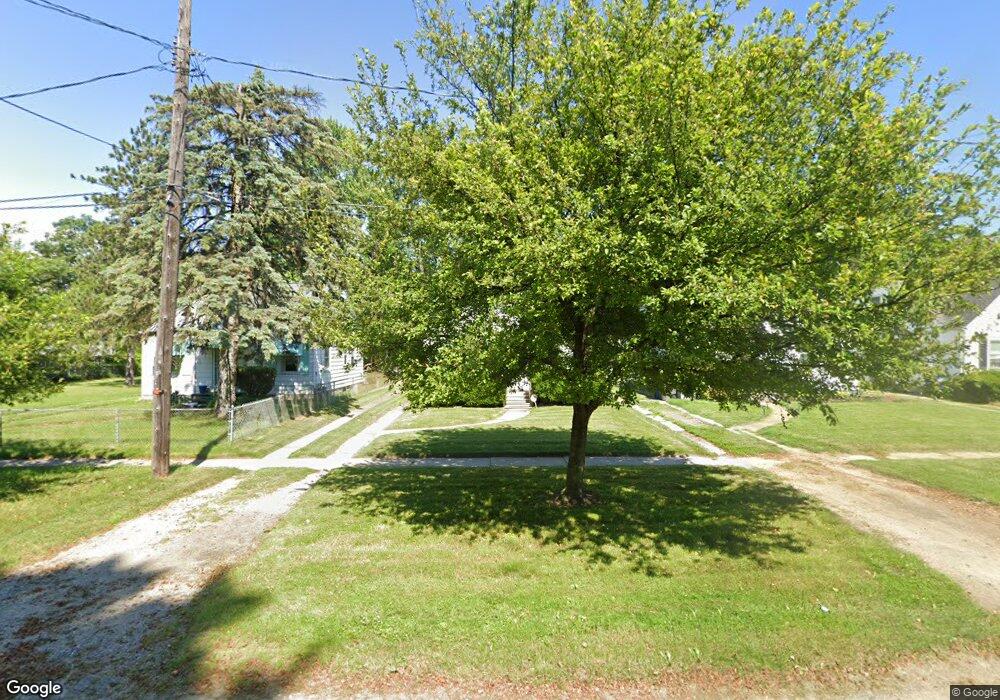
1206 Brookley Blvd Toledo, OH 43607
Scott Park NeighborhoodEstimated Value: $65,000 - $92,000
2
Beds
1
Bath
737
Sq Ft
$108/Sq Ft
Est. Value
About This Home
This home is located at 1206 Brookley Blvd, Toledo, OH 43607 and is currently estimated at $79,880, approximately $108 per square foot. 1206 Brookley Blvd is a home located in Lucas County with nearby schools including Keyser Elementary School, Rogers High School, and Victory Academy of Toledo.
Ownership History
Date
Name
Owned For
Owner Type
Purchase Details
Closed on
Feb 26, 1998
Sold by
Miller Ray M
Bought by
Miller Ray M and Miller Kimberlie C
Current Estimated Value
Home Financials for this Owner
Home Financials are based on the most recent Mortgage that was taken out on this home.
Original Mortgage
$29,000
Outstanding Balance
$5,170
Interest Rate
7.08%
Estimated Equity
$74,710
Purchase Details
Closed on
Nov 19, 1996
Sold by
Miller Wilbert
Bought by
Miller Ray M
Home Financials for this Owner
Home Financials are based on the most recent Mortgage that was taken out on this home.
Original Mortgage
$27,500
Interest Rate
8.18%
Mortgage Type
New Conventional
Purchase Details
Closed on
Sep 26, 1990
Sold by
Miller Goston H
Purchase Details
Closed on
Nov 29, 1989
Sold by
Kosch Shirley
Purchase Details
Closed on
Mar 7, 1989
Sold by
Kocinski Pearl A
Purchase Details
Closed on
Jul 13, 1988
Sold by
Kitting P A
Create a Home Valuation Report for This Property
The Home Valuation Report is an in-depth analysis detailing your home's value as well as a comparison with similar homes in the area
Home Values in the Area
Average Home Value in this Area
Purchase History
| Date | Buyer | Sale Price | Title Company |
|---|---|---|---|
| Miller Ray M | -- | -- | |
| Miller Ray M | $26,500 | -- | |
| -- | -- | -- | |
| -- | $30,000 | -- | |
| -- | -- | -- | |
| -- | -- | -- |
Source: Public Records
Mortgage History
| Date | Status | Borrower | Loan Amount |
|---|---|---|---|
| Open | Miller Ray M | $29,000 | |
| Closed | Miller Ray M | $27,500 |
Source: Public Records
Tax History Compared to Growth
Tax History
| Year | Tax Paid | Tax Assessment Tax Assessment Total Assessment is a certain percentage of the fair market value that is determined by local assessors to be the total taxable value of land and additions on the property. | Land | Improvement |
|---|---|---|---|---|
| 2024 | $18,995 | $18,585 | $5,810 | $12,775 |
| 2023 | $1,068 | $15,190 | $3,500 | $11,690 |
| 2022 | $1,058 | $15,190 | $3,500 | $11,690 |
| 2021 | $1,095 | $15,190 | $3,500 | $11,690 |
| 2020 | $1,161 | $14,175 | $3,220 | $10,955 |
| 2019 | $1,121 | $14,175 | $3,220 | $10,955 |
| 2018 | $1,140 | $14,175 | $3,220 | $10,955 |
| 2017 | $6,205 | $13,860 | $3,150 | $10,710 |
| 2016 | $8,225 | $39,600 | $9,000 | $30,600 |
| 2015 | $1,153 | $39,600 | $9,000 | $30,600 |
| 2014 | $1,344 | $13,860 | $3,150 | $10,710 |
| 2013 | $896 | $13,860 | $3,150 | $10,710 |
Source: Public Records
Map
Nearby Homes
- 1117 Broer Ave
- 826 Ranch Dr
- 914 Turner Ave
- 1125 Secor Rd
- 1408 Roosevelt Ave
- 615 Cuthbert Rd
- 2013 Bretton Place
- 2666 Montebello Rd
- 3155 Kylemore Rd
- 3205 Kylemore Rd
- 1752 Pilgrim Rd
- 1809 Pilgrim Rd
- 1702 Alvin St
- 1911 Kensington Rd
- 1730 Alvin St
- 514 Conrad Ave
- 2547 Greenbriar Rd
- 1814 Alvin St
- 1735 Perth St
- 1901 Alvin St
- 1210 Brookley Blvd
- 1202 Brookley Blvd
- 1132 Brookley Blvd
- 1128 Brookley Blvd
- 1124 Brookley Blvd
- 1120 Brookley Blvd
- 1116 Brookley Blvd
- 1205 Brookley Blvd
- 1209 Brookley Blvd
- 1201 Brookley Blvd
- 1215 Brookley Blvd
- 3043 Dorr St
- 1127 Brookley Blvd
- 1112 Brookley Blvd
- 1123 Brookley Blvd
- 3047 Dorr St
- 1119 Brookley Blvd
- 1106 Brookley Blvd
- 1115 Brookley Blvd
- 1102 Brookley Blvd