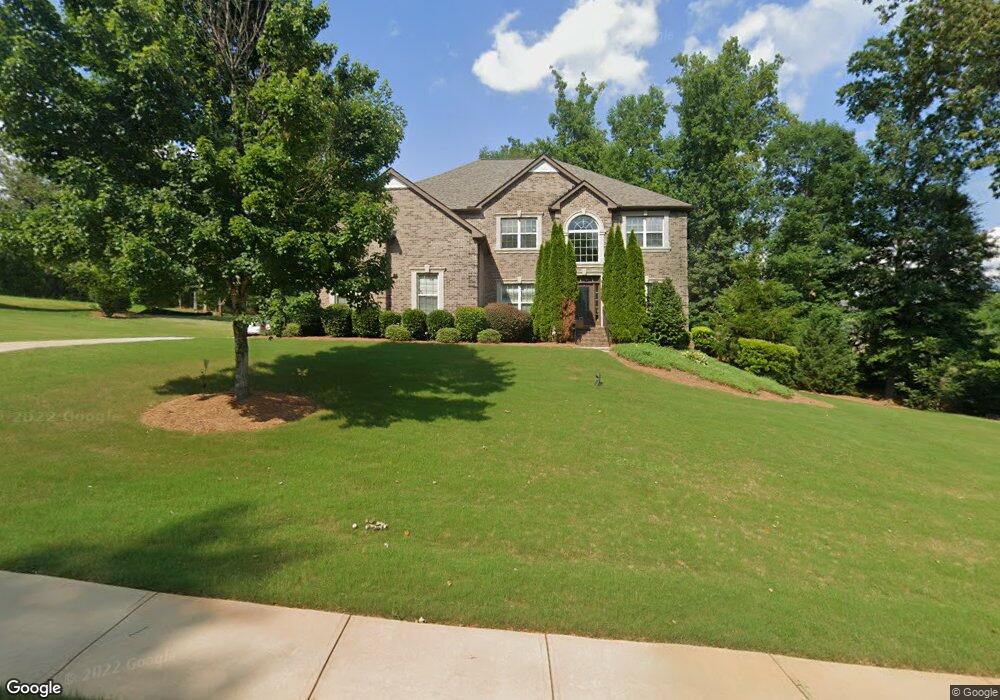
1206 Castle Point Ct SW Conyers, GA 30094
Estimated Value: $514,855 - $666,000
5
Beds
4
Baths
3,756
Sq Ft
$156/Sq Ft
Est. Value
About This Home
This home is located at 1206 Castle Point Ct SW, Conyers, GA 30094 and is currently estimated at $584,714, approximately $155 per square foot. 1206 Castle Point Ct SW is a home located in Rockdale County with nearby schools including Shoal Creek Elementary School, Gen. Ray Davis Middle School, and Heritage High School.
Ownership History
Date
Name
Owned For
Owner Type
Purchase Details
Closed on
May 15, 2017
Sold by
Scott Alichia M
Bought by
Scott Alichia M and Wicker Ryan P
Current Estimated Value
Home Financials for this Owner
Home Financials are based on the most recent Mortgage that was taken out on this home.
Original Mortgage
$291,000
Outstanding Balance
$241,870
Interest Rate
4.08%
Mortgage Type
New Conventional
Estimated Equity
$342,844
Purchase Details
Closed on
Mar 9, 2017
Sold by
Wells Fargo Bk Na
Bought by
The Sec Of Housing & U
Purchase Details
Closed on
Nov 1, 2016
Sold by
Johnny W
Bought by
Wells Fargo Bank
Purchase Details
Closed on
Sep 18, 2008
Sold by
Abington Homes Llc
Bought by
Williams Johnny W
Home Financials for this Owner
Home Financials are based on the most recent Mortgage that was taken out on this home.
Original Mortgage
$341,040
Interest Rate
5.75%
Mortgage Type
FHA
Create a Home Valuation Report for This Property
The Home Valuation Report is an in-depth analysis detailing your home's value as well as a comparison with similar homes in the area
Home Values in the Area
Average Home Value in this Area
Purchase History
| Date | Buyer | Sale Price | Title Company |
|---|---|---|---|
| Scott Alichia M | -- | -- | |
| Scott Alichia M | $300,000 | -- | |
| The Sec Of Housing & U | -- | -- | |
| Wells Fargo Bank | -- | -- | |
| Williams Johnny W | $354,000 | -- |
Source: Public Records
Mortgage History
| Date | Status | Borrower | Loan Amount |
|---|---|---|---|
| Open | Scott Alichia M | $291,000 | |
| Closed | Scott Alichia M | $291,000 | |
| Previous Owner | Williams Johnny W | $341,040 |
Source: Public Records
Tax History Compared to Growth
Tax History
| Year | Tax Paid | Tax Assessment Tax Assessment Total Assessment is a certain percentage of the fair market value that is determined by local assessors to be the total taxable value of land and additions on the property. | Land | Improvement |
|---|---|---|---|---|
| 2024 | $4,824 | $189,480 | $46,320 | $143,160 |
| 2023 | $4,032 | $164,760 | $40,920 | $123,840 |
| 2022 | $3,860 | $158,080 | $40,920 | $117,160 |
| 2021 | $2,835 | $110,960 | $29,480 | $81,480 |
| 2020 | $2,506 | $96,080 | $14,600 | $81,480 |
| 2019 | $2,567 | $96,080 | $14,600 | $81,480 |
| 2018 | $2,583 | $96,080 | $14,600 | $81,480 |
| 2017 | $4,054 | $87,480 | $14,600 | $72,880 |
| 2016 | $2,172 | $87,480 | $14,600 | $72,880 |
| 2015 | $2,176 | $87,480 | $14,600 | $72,880 |
| 2014 | $1,949 | $87,480 | $14,600 | $72,880 |
| 2013 | -- | $134,920 | $40,000 | $94,920 |
Source: Public Records
Map
Nearby Homes
- 1221 Rhodes Walk SW
- 1103 W Adrian Cir SW
- 2923 Hurst Rd SW
- 3011 Flat Shoals Rd SW
- 1092 W Adrian Cir SW
- 2881 Bridle Creek Dr SW Unit 1
- 1084 W Adrian Cir SW
- 2887 Bridle Creek Dr SW
- 1087 W Adrian Cir SW
- 1401 Stone Bridge Ln SW
- 1048 Falls Brooke Dr
- 2856 Flat Shoals Rd SW
- 981 Havenridge Dr SW
- 2917 Bridle Creek Dr SW Unit 2
- 3190 Water Brook Dr SW
- 3208 Highpoint Way SW
- 2900 Waterford Dr SW
- 3250 Klondike Rd SW
- 2215 Brandon Ln SW Unit 3
- 1240 Falls Creek Ct
- 1200 Castle Point Ct SW Unit LOT 14
- 1200 Castle Point Ct SW
- 1220 Castle Point Ct SW
- 0 Castle Point Ct SW Unit 7290069
- 1232 Castle Point Ct SW Unit LOT 10
- 1232 Castle Point Ct SW
- 1207 Castle Point Ct SW
- 1201 Castle Point Ct SW
- 1228 Castle Point Ct SW Unit LOT 11
- 1228 Castle Point Ct SW
- 1236 Castle Point Ct SW Unit LOT 9
- 1236 Castle Point Ct SW
- 1236 Castle Point Ct SW Unit 9
- 1300 Ruth Ln SW Unit 59
- 1300 Ruth Ln SW
- 1219 Castle Point Ct SW
- 3012 Flat Shoals Rd SW Unit 50
- 3012 Flat Shoals Rd SW
- 1223 Castle Point Ct SW
- 2900 Klondike Rd SW