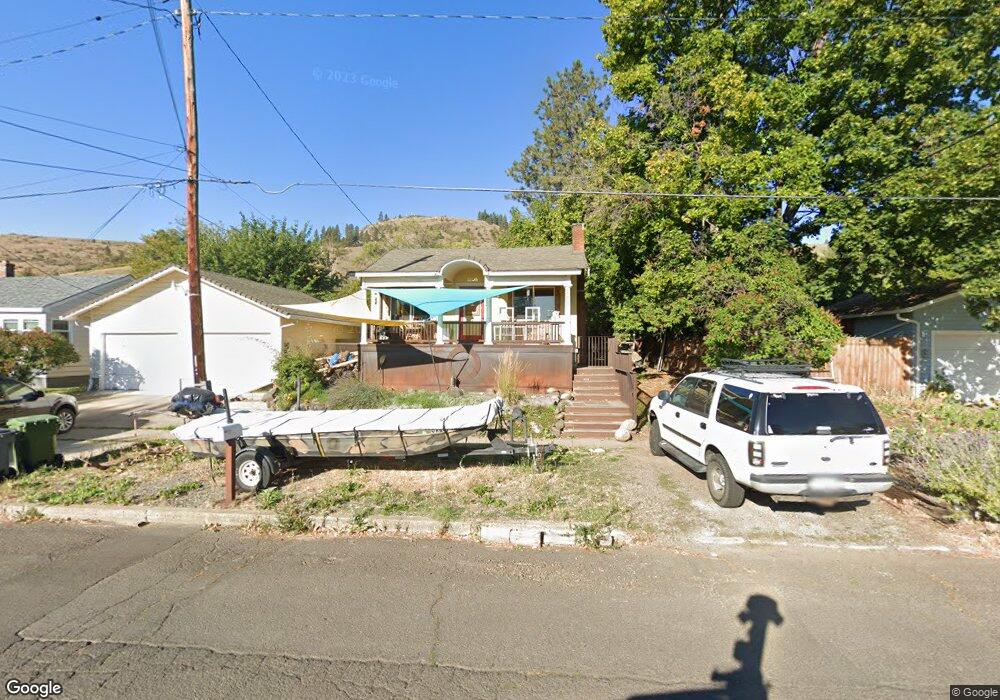
1206 Cedar St La Grande, OR 97850
Estimated Value: $211,000 - $265,378
2
Beds
1
Bath
1,287
Sq Ft
$185/Sq Ft
Est. Value
About This Home
This home is located at 1206 Cedar St, La Grande, OR 97850 and is currently estimated at $238,189, approximately $185 per square foot. 1206 Cedar St is a home located in Union County with nearby schools including La Grande High School, The Marian Academy, and Grande Ronde Academy.
Ownership History
Date
Name
Owned For
Owner Type
Purchase Details
Closed on
Nov 2, 2018
Sold by
Dittman Bonnie and Hayslett Bonnie
Bought by
Dittman Bonnie and Dittman Kurt
Current Estimated Value
Purchase Details
Closed on
Jul 15, 2016
Sold by
Devillier David A
Bought by
Hayslett Bonnie M
Home Financials for this Owner
Home Financials are based on the most recent Mortgage that was taken out on this home.
Original Mortgage
$92,320
Outstanding Balance
$73,691
Interest Rate
3.66%
Mortgage Type
New Conventional
Estimated Equity
$164,498
Create a Home Valuation Report for This Property
The Home Valuation Report is an in-depth analysis detailing your home's value as well as a comparison with similar homes in the area
Home Values in the Area
Average Home Value in this Area
Purchase History
| Date | Buyer | Sale Price | Title Company |
|---|---|---|---|
| Dittman Bonnie | -- | None Available | |
| Hayslett Bonnie M | $100,000 | Eastern Oregon Title Inc |
Source: Public Records
Mortgage History
| Date | Status | Borrower | Loan Amount |
|---|---|---|---|
| Open | Hayslett Bonnie M | $92,320 |
Source: Public Records
Tax History Compared to Growth
Tax History
| Year | Tax Paid | Tax Assessment Tax Assessment Total Assessment is a certain percentage of the fair market value that is determined by local assessors to be the total taxable value of land and additions on the property. | Land | Improvement |
|---|---|---|---|---|
| 2025 | $2,074 | $114,610 | $30,940 | $83,670 |
| 2024 | $2,003 | $111,280 | $30,040 | $81,240 |
| 2023 | $1,968 | $108,040 | $29,160 | $78,880 |
| 2022 | $1,915 | $104,899 | $28,316 | $76,583 |
| 2021 | $1,867 | $101,844 | $27,907 | $73,937 |
| 2020 | $1,792 | $98,878 | $27,124 | $71,754 |
| 2019 | $1,754 | $95,999 | $26,477 | $69,522 |
| 2018 | $1,708 | $93,203 | $24,238 | $68,965 |
| 2017 | $1,659 | $90,489 | $23,829 | $66,660 |
| 2016 | $1,610 | $87,854 | $23,243 | $64,611 |
| 2015 | $1,552 | $85,296 | $22,620 | $62,676 |
| 2014 | $1,348 | $82,812 | $22,043 | $60,769 |
| 2013 | $1,309 | $80,400 | $21,375 | $59,025 |
Source: Public Records
Map
Nearby Homes