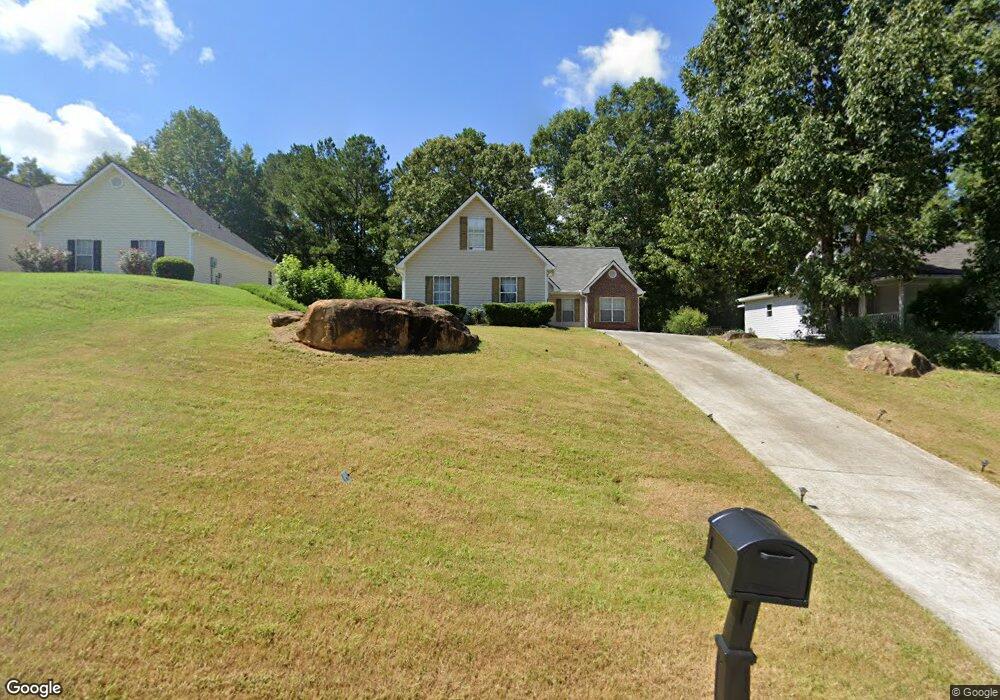
1206 Dressage Ridge NE Conyers, GA 30013
Estimated Value: $233,000 - $277,000
3
Beds
2
Baths
1,403
Sq Ft
$182/Sq Ft
Est. Value
About This Home
This home is located at 1206 Dressage Ridge NE, Conyers, GA 30013 and is currently estimated at $254,996, approximately $181 per square foot. 1206 Dressage Ridge NE is a home located in Rockdale County with nearby schools including Hicks Elementary School, Conyers Middle School, and Rockdale County High School.
Ownership History
Date
Name
Owned For
Owner Type
Purchase Details
Closed on
Dec 19, 2019
Sold by
Hale Chester
Bought by
Hale Keeyata M
Current Estimated Value
Home Financials for this Owner
Home Financials are based on the most recent Mortgage that was taken out on this home.
Original Mortgage
$116,400
Outstanding Balance
$102,623
Interest Rate
3.6%
Mortgage Type
New Conventional
Estimated Equity
$152,373
Purchase Details
Closed on
Dec 23, 2011
Sold by
Secretary Of Housing And U
Bought by
Hale Chester and Hale Lorraine S
Home Financials for this Owner
Home Financials are based on the most recent Mortgage that was taken out on this home.
Original Mortgage
$41,430
Interest Rate
4.25%
Mortgage Type
FHA
Purchase Details
Closed on
Aug 3, 2010
Sold by
Wells Fargo Bk Na
Bought by
Hud-Housing Of Urban Dev
Purchase Details
Closed on
Dec 29, 1998
Sold by
Thompson Builders Inc
Bought by
Rychlicki Victor
Home Financials for this Owner
Home Financials are based on the most recent Mortgage that was taken out on this home.
Original Mortgage
$109,049
Interest Rate
6.87%
Mortgage Type
FHA
Create a Home Valuation Report for This Property
The Home Valuation Report is an in-depth analysis detailing your home's value as well as a comparison with similar homes in the area
Home Values in the Area
Average Home Value in this Area
Purchase History
| Date | Buyer | Sale Price | Title Company |
|---|---|---|---|
| Hale Keeyata M | $120,000 | -- | |
| Hale Chester | $38,700 | -- | |
| Hud-Housing Of Urban Dev | $102,769 | -- | |
| Wells Fargo Bk Na | $102,769 | -- | |
| Rychlicki Victor | $110,000 | -- |
Source: Public Records
Mortgage History
| Date | Status | Borrower | Loan Amount |
|---|---|---|---|
| Open | Hale Keeyata M | $116,400 | |
| Previous Owner | Hale Chester | $41,430 | |
| Previous Owner | Rychlicki Victor | $109,049 |
Source: Public Records
Tax History Compared to Growth
Tax History
| Year | Tax Paid | Tax Assessment Tax Assessment Total Assessment is a certain percentage of the fair market value that is determined by local assessors to be the total taxable value of land and additions on the property. | Land | Improvement |
|---|---|---|---|---|
| 2024 | $2,559 | $107,000 | $22,640 | $84,360 |
| 2023 | $1,990 | $88,080 | $20,400 | $67,680 |
| 2022 | $2,997 | $72,640 | $15,200 | $57,440 |
| 2021 | $2,504 | $60,960 | $10,800 | $50,160 |
| 2020 | $2,184 | $51,240 | $10,000 | $41,240 |
| 2019 | $1,878 | $41,840 | $7,200 | $34,640 |
| 2018 | $1,777 | $39,400 | $6,400 | $33,000 |
| 2017 | $1,487 | $32,680 | $5,200 | $27,480 |
| 2016 | $1,487 | $32,680 | $5,200 | $27,480 |
| 2015 | $1,469 | $32,240 | $5,200 | $27,040 |
| 2014 | $1,273 | $27,640 | $5,200 | $22,440 |
| 2013 | -- | $15,480 | $3,225 | $12,254 |
Source: Public Records
Map
Nearby Homes
- 2284 Bear Mountain Dr NE
- 3013 Pommel Ct
- 1275 Mountain Dr NE
- 1508 Chelsea Downs Dr NE
- 2184 Pine Knoll Cir NE
- 1288 Lakewood Dr NE
- 2173 Tanglewood Trail NE
- 1270 Pine Knoll Ln NE
- 2350 Highway 138 NE
- 1406 Queenie Smith Rd NE
- 2131 Bridgestone Business Pkwy
- 1903 Cobblestone Ct
- 1915 Cornerstone Pass
- 2008 Harvest Mill Run
- 1641 Riverchase Cir NE
- 1526 Battle Brook Dr
- 2712 Potters Walk
- 1869 Millstone Manor
- 1722 River Mill Trail NE
- 1954 Bridgestone Cir
- 1208 Dressage Ridge NE
- 1204 Dressage Ridge NE
- N Dressage Ridge NE
- 1210 Dressage Ridge NE
- 2265 Bear Mountain Dr NE
- 2310 Rock Mill Ln NE
- 2269 Bear Mountain Dr NE
- 2312 Rock Mill Ln NE
- 2273 Bear Mountain Dr NE
- 2308 Rock Mill Ln NE
- 1209 Dressage Ridge NE
- 1207 Dressage Ridge NE
- 1205 Dressage Ridge NE
- 1211 Dressage Ridge NE
- 1212 Dressage Ridge NE
- 2277 Bear Mountain Dr NE
- 1203 Dressage Ridge NE
- 1213 Dressage Ridge NE
- 1213 Dressage Ridge NE Unit 1213
- 1213 Dressage Ridge NE