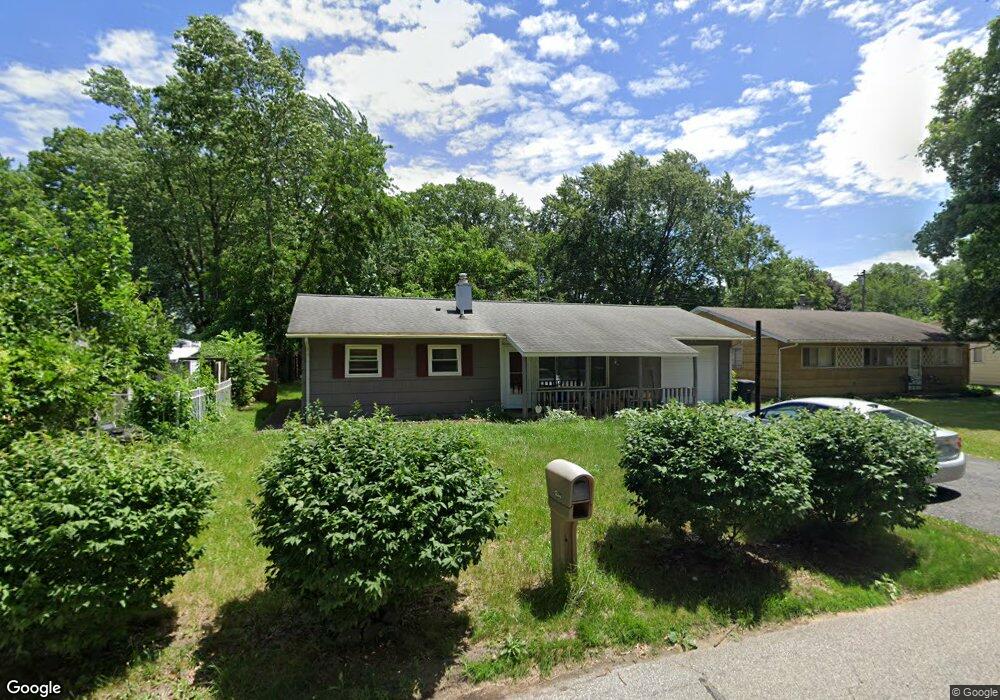
1206 Hoyt St Michigan City, IN 46360
Estimated Value: $153,000 - $172,000
3
Beds
1
Bath
975
Sq Ft
$165/Sq Ft
Est. Value
About This Home
This home is located at 1206 Hoyt St, Michigan City, IN 46360 and is currently estimated at $160,848, approximately $164 per square foot. 1206 Hoyt St is a home located in LaPorte County with nearby schools including Knapp Elementary School, Barker Middle School, and Michigan City High School.
Ownership History
Date
Name
Owned For
Owner Type
Purchase Details
Closed on
Dec 14, 2018
Sold by
Schoff Stroud Joellen J
Bought by
Schoff Stroud Joellen J and Stroud Aaron R
Current Estimated Value
Purchase Details
Closed on
Oct 12, 2018
Sold by
Porter Louann
Bought by
Schoff Stroud Joellen J
Home Financials for this Owner
Home Financials are based on the most recent Mortgage that was taken out on this home.
Original Mortgage
$90,333
Outstanding Balance
$80,375
Interest Rate
5.5%
Mortgage Type
FHA
Estimated Equity
$80,473
Create a Home Valuation Report for This Property
The Home Valuation Report is an in-depth analysis detailing your home's value as well as a comparison with similar homes in the area
Home Values in the Area
Average Home Value in this Area
Purchase History
| Date | Buyer | Sale Price | Title Company |
|---|---|---|---|
| Schoff Stroud Joellen J | -- | None Available | |
| Schoff Stroud Joellen J | -- | Fidelity National Title Co |
Source: Public Records
Mortgage History
| Date | Status | Borrower | Loan Amount |
|---|---|---|---|
| Open | Schoff Stroud Joellen J | $90,333 |
Source: Public Records
Tax History Compared to Growth
Tax History
| Year | Tax Paid | Tax Assessment Tax Assessment Total Assessment is a certain percentage of the fair market value that is determined by local assessors to be the total taxable value of land and additions on the property. | Land | Improvement |
|---|---|---|---|---|
| 2024 | $1,073 | $118,500 | $19,500 | $99,000 |
| 2022 | $964 | $96,400 | $19,500 | $76,900 |
| 2021 | $951 | $95,100 | $19,500 | $75,600 |
| 2020 | $867 | $95,100 | $19,500 | $75,600 |
| 2019 | $736 | $78,200 | $17,400 | $60,800 |
| 2018 | $746 | $69,800 | $11,700 | $58,100 |
| 2017 | $715 | $66,700 | $11,700 | $55,000 |
| 2016 | $652 | $64,100 | $9,800 | $54,300 |
| 2014 | $533 | $67,600 | $9,800 | $57,800 |
Source: Public Records
Map
Nearby Homes