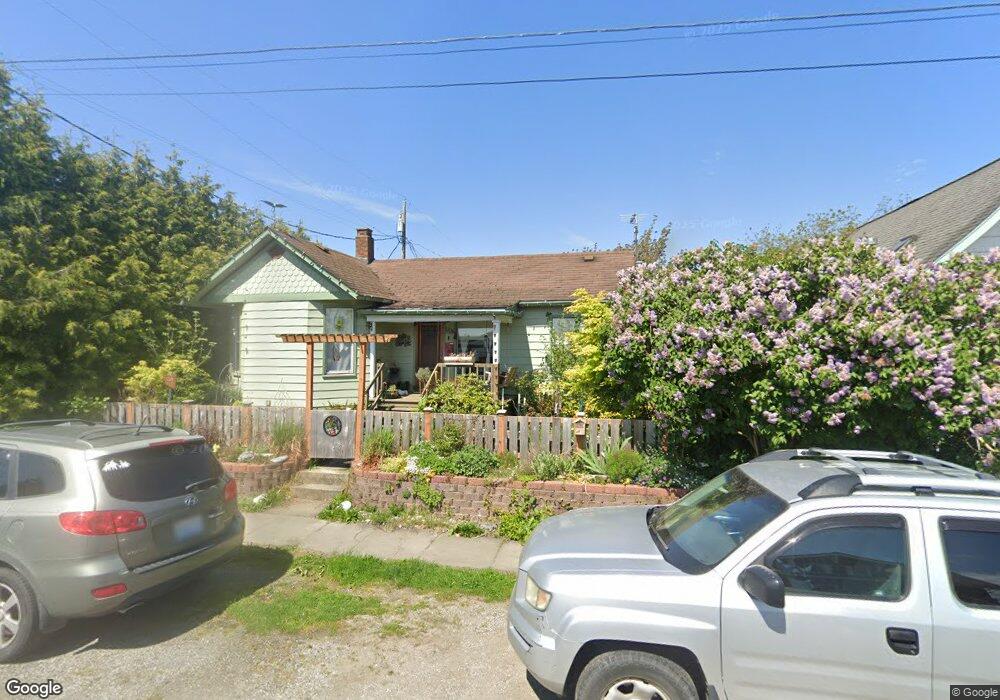
1206 Jefferson St Bellingham, WA 98225
Columbia NeighborhoodEstimated Value: $630,736 - $693,000
3
Beds
2
Baths
1,004
Sq Ft
$655/Sq Ft
Est. Value
About This Home
This home is located at 1206 Jefferson St, Bellingham, WA 98225 and is currently estimated at $657,684, approximately $655 per square foot. 1206 Jefferson St is a home located in Whatcom County with nearby schools including Columbia Elementary School, Whatcom Middle School, and Bellingham High School.
Ownership History
Date
Name
Owned For
Owner Type
Purchase Details
Closed on
Nov 19, 2007
Sold by
Schroeder Pablo G
Bought by
Nickle Timothy Roy and Matsumoto Grah Anna Take
Current Estimated Value
Home Financials for this Owner
Home Financials are based on the most recent Mortgage that was taken out on this home.
Original Mortgage
$224,910
Outstanding Balance
$142,303
Interest Rate
6.38%
Mortgage Type
Purchase Money Mortgage
Estimated Equity
$515,381
Purchase Details
Closed on
May 20, 2005
Sold by
Steiner Peterson Valerie C and Peterson Jeremie
Bought by
Schroeder Pablo G
Home Financials for this Owner
Home Financials are based on the most recent Mortgage that was taken out on this home.
Original Mortgage
$186,010
Interest Rate
5.12%
Mortgage Type
Fannie Mae Freddie Mac
Purchase Details
Closed on
Feb 16, 2001
Sold by
Wilson Alan and Wilson Shannon L
Bought by
Steiner Valerie C
Home Financials for this Owner
Home Financials are based on the most recent Mortgage that was taken out on this home.
Original Mortgage
$112,633
Interest Rate
6.89%
Mortgage Type
FHA
Create a Home Valuation Report for This Property
The Home Valuation Report is an in-depth analysis detailing your home's value as well as a comparison with similar homes in the area
Home Values in the Area
Average Home Value in this Area
Purchase History
| Date | Buyer | Sale Price | Title Company |
|---|---|---|---|
| Nickle Timothy Roy | $250,270 | Whatcom Land Title | |
| Schroeder Pablo G | $195,800 | Stewart Title Company | |
| Steiner Valerie C | $113,900 | First American Title Insuran |
Source: Public Records
Mortgage History
| Date | Status | Borrower | Loan Amount |
|---|---|---|---|
| Open | Nickle Timothy Roy | $224,910 | |
| Previous Owner | Schroeder Pablo G | $186,010 | |
| Previous Owner | Steiner Valerie C | $112,633 |
Source: Public Records
Tax History Compared to Growth
Tax History
| Year | Tax Paid | Tax Assessment Tax Assessment Total Assessment is a certain percentage of the fair market value that is determined by local assessors to be the total taxable value of land and additions on the property. | Land | Improvement |
|---|---|---|---|---|
| 2024 | $5,711 | $715,615 | $270,928 | $444,687 |
| 2023 | $5,711 | $733,831 | $277,824 | $456,007 |
| 2022 | $3,564 | $632,614 | $239,504 | $393,110 |
| 2021 | $3,082 | $383,698 | $172,800 | $210,898 |
| 2020 | $3,083 | $313,171 | $160,000 | $153,171 |
| 2019 | $2,760 | $302,770 | $124,778 | $177,992 |
| 2018 | $2,779 | $271,781 | $112,028 | $159,753 |
| 2017 | $2,397 | $233,994 | $96,450 | $137,544 |
| 2016 | $2,098 | $210,898 | $86,550 | $124,348 |
| 2015 | $2,057 | $192,133 | $79,050 | $113,083 |
| 2014 | -- | $182,289 | $75,000 | $107,289 |
| 2013 | -- | $187,514 | $73,500 | $114,014 |
Source: Public Records
Map
Nearby Homes
- 2500 Meridian St
- 2600 Elm St
- 1800 J St
- 1410 J St
- 1315 Astor St
- 2805 Walnut St
- 1200 W Holly St
- 2218 Jaeger St
- 3008 Meridian St
- 3018 Elm St
- 2500 Cornwall Ave
- 2019 Cornwall Ave
- 1508 E Maplewood Ave
- 2111 Franklin St
- 1025 Granary Ave Unit 503
- 1025 Granary Ave Unit 404
- 1025 Granary Ave Unit 306
- 1025 Granary Ave Unit 506
- 1025 Granary Ave Unit 501-A
- 1025 Granary Ave Unit 307-B