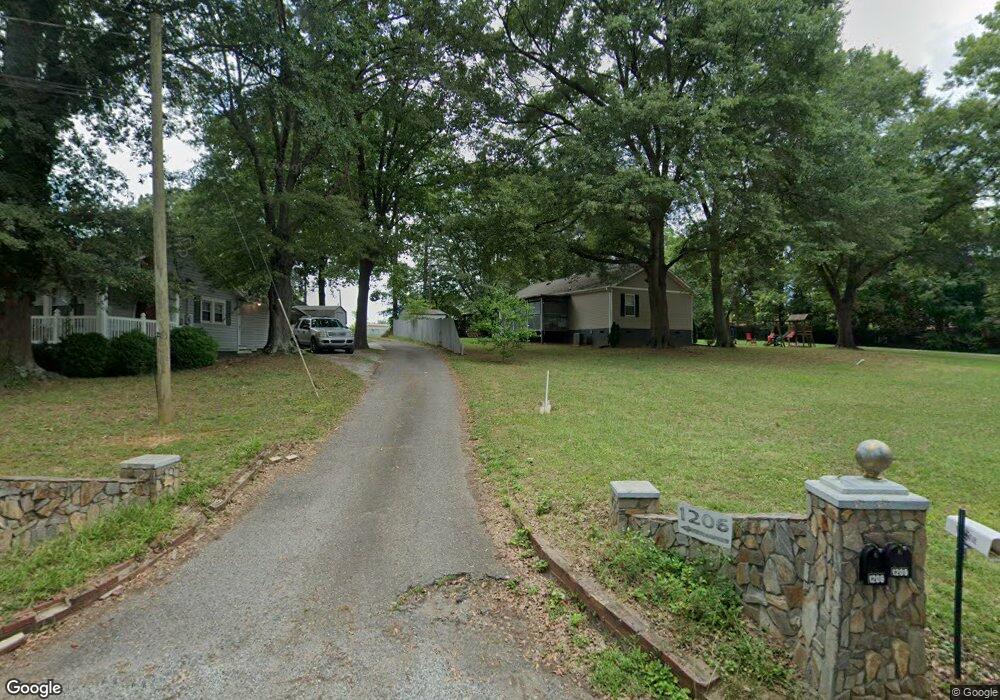
1206 Lackey St Shelby, NC 28152
Estimated Value: $198,000 - $230,000
Studio
--
Bath
1,279
Sq Ft
$166/Sq Ft
Est. Value
About This Home
This home is located at 1206 Lackey St, Shelby, NC 28152 and is currently estimated at $212,308, approximately $165 per square foot. 1206 Lackey St is a home located in Cleveland County with nearby schools including James Love Elementary School, Shelby Middle School, and Shelby High School.
Ownership History
Date
Name
Owned For
Owner Type
Purchase Details
Closed on
Nov 1, 2024
Sold by
Bryant Mary R
Bought by
Chapman Larry and Rudd Dean E
Current Estimated Value
Home Financials for this Owner
Home Financials are based on the most recent Mortgage that was taken out on this home.
Original Mortgage
$93,537
Outstanding Balance
$92,601
Interest Rate
6.09%
Mortgage Type
New Conventional
Estimated Equity
$119,707
Purchase Details
Closed on
Oct 2, 2017
Sold by
Bethel Baptist Church
Bought by
Bryant Mary R
Home Financials for this Owner
Home Financials are based on the most recent Mortgage that was taken out on this home.
Original Mortgage
$43,104
Interest Rate
4.25%
Mortgage Type
FHA
Purchase Details
Closed on
Oct 6, 2008
Sold by
Butler Max P and Butler Marion D
Bought by
Butler Properties Of Cleveland County Ll
Create a Home Valuation Report for This Property
The Home Valuation Report is an in-depth analysis detailing your home's value as well as a comparison with similar homes in the area
Home Values in the Area
Average Home Value in this Area
Purchase History
| Date | Buyer | Sale Price | Title Company |
|---|---|---|---|
| Chapman Larry | $200,000 | None Listed On Document | |
| Chapman Larry | $200,000 | None Listed On Document | |
| Bryant Mary R | $44,000 | None Available | |
| Butler Properties Of Cleveland County Ll | -- | None Available |
Source: Public Records
Mortgage History
| Date | Status | Borrower | Loan Amount |
|---|---|---|---|
| Open | Chapman Larry | $93,537 | |
| Closed | Chapman Larry | $93,537 | |
| Previous Owner | Bryant Mary R | $43,104 |
Source: Public Records
Tax History
| Year | Tax Paid | Tax Assessment Tax Assessment Total Assessment is a certain percentage of the fair market value that is determined by local assessors to be the total taxable value of land and additions on the property. | Land | Improvement |
|---|---|---|---|---|
| 2025 | $1,679 | $168,719 | $22,037 | $146,682 |
| 2024 | $883 | $71,217 | $19,007 | $52,210 |
| 2023 | $879 | $71,217 | $19,007 | $52,210 |
| 2022 | $879 | $71,217 | $19,007 | $52,210 |
| 2021 | $883 | $71,217 | $19,007 | $52,210 |
| 2020 | $848 | $66,462 | $19,007 | $47,455 |
| 2019 | $848 | $66,462 | $19,007 | $47,455 |
| 2018 | $847 | $66,462 | $19,007 | $47,455 |
| 2017 | $826 | $66,462 | $19,007 | $47,455 |
| 2016 | $828 | $66,462 | $19,007 | $47,455 |
| 2015 | $854 | $72,329 | $13,774 | $58,555 |
| 2014 | $854 | $72,329 | $13,774 | $58,555 |
Source: Public Records
Map
Nearby Homes
- 627 Tina Dr
- 1303 Hunt St
- 905a Linney Ln
- 901 Linney Ln
- 900 Linney Ln
- 697 Branton Dr
- 1325 Eastview Extension
- 1102 W Elm St
- 420 Stroud Rd
- 1317 Wyanoke Ave
- 901 W Elm St
- 809 Howard St
- 1405 Hubbard Terrace
- 1303 W Dixon Blvd
- 412 Franklin Ave
- 821 Hamrick St
- 812 Hill St
- 409 Gold St
- 603 Calvary St
- 1313 Dockery Dr Unit 1
Your Personal Tour Guide
Ask me questions while you tour the home.