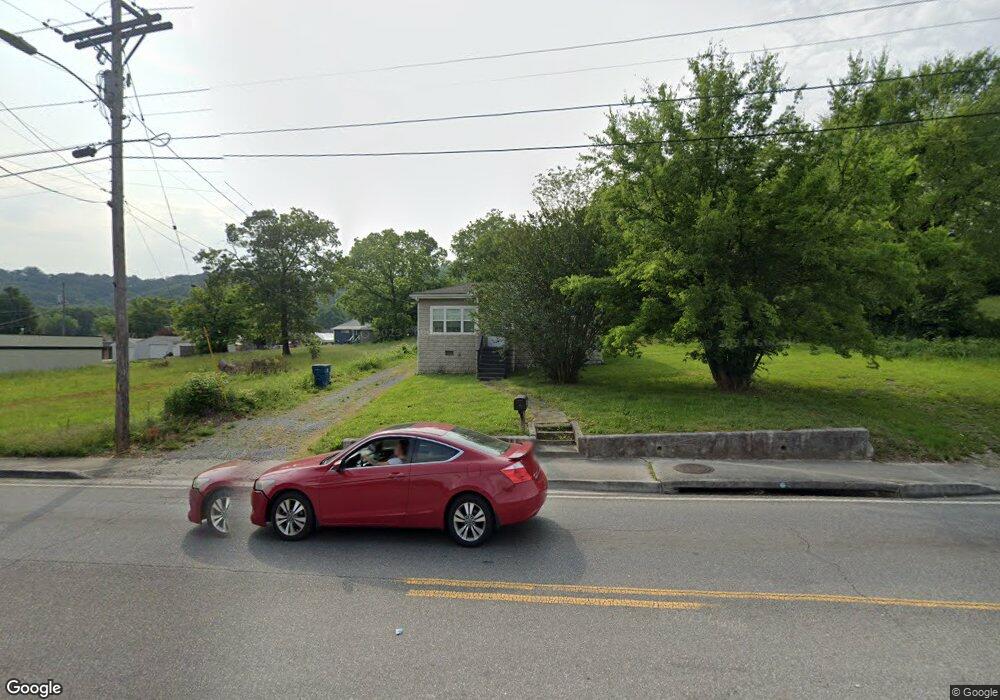
1206 Mcfarland Ave Rossville, GA 30741
Estimated Value: $138,000 - $141,000
2
Beds
1
Bath
775
Sq Ft
$180/Sq Ft
Est. Value
About This Home
This home is located at 1206 Mcfarland Ave, Rossville, GA 30741 and is currently estimated at $139,280, approximately $179 per square foot. 1206 Mcfarland Ave is a home located in Walker County with nearby schools including Rossville Elementary School, Rossville Middle School, and Ridgeland High School.
Ownership History
Date
Name
Owned For
Owner Type
Purchase Details
Closed on
Jun 30, 2020
Sold by
Srw Properties Llc
Bought by
Srw Properties Opportunity Fund Llc
Current Estimated Value
Purchase Details
Closed on
Jul 30, 2019
Sold by
Hicks Dorothy T
Bought by
Hicks Michael J
Purchase Details
Closed on
Mar 28, 2008
Sold by
Atkins James
Bought by
Hicks Michael J and Hicks Dorothy Teah
Purchase Details
Closed on
Jun 1, 2007
Sold by
Phillips Charles J
Bought by
Atkins James
Purchase Details
Closed on
Apr 16, 1979
Sold by
Hipple James L and Hipple Mary
Bought by
Phillips Charles J and Phillips Shirley
Purchase Details
Closed on
Oct 11, 1978
Sold by
Reeves George W and Reeves Donna
Bought by
Hipple James L and Hipple Mary
Purchase Details
Closed on
Sep 1, 1976
Sold by
Thomas Franklin D and Thomas Peggy
Bought by
Reeves George W and Reeves Donna
Purchase Details
Closed on
Apr 1, 1968
Bought by
Thomas Franklin D and Thomas Peggy
Create a Home Valuation Report for This Property
The Home Valuation Report is an in-depth analysis detailing your home's value as well as a comparison with similar homes in the area
Home Values in the Area
Average Home Value in this Area
Purchase History
| Date | Buyer | Sale Price | Title Company |
|---|---|---|---|
| Srw Properties Opportunity Fund Llc | -- | -- | |
| Hicks Michael J | -- | -- | |
| Hicks Michael J | $20,000 | -- | |
| Atkins James | $13,500 | -- | |
| Phillips Charles J | $3,400 | -- | |
| Hipple James L | -- | -- | |
| Reeves George W | -- | -- | |
| Thomas Franklin D | -- | -- |
Source: Public Records
Tax History Compared to Growth
Tax History
| Year | Tax Paid | Tax Assessment Tax Assessment Total Assessment is a certain percentage of the fair market value that is determined by local assessors to be the total taxable value of land and additions on the property. | Land | Improvement |
|---|---|---|---|---|
| 2024 | $1,418 | $43,420 | $3,640 | $39,780 |
| 2023 | $1,347 | $40,815 | $3,250 | $37,565 |
| 2022 | $620 | $23,566 | $3,087 | $20,479 |
| 2021 | $446 | $15,192 | $3,087 | $12,105 |
| 2020 | $409 | $13,343 | $3,087 | $10,256 |
| 2019 | $462 | $15,038 | $3,087 | $11,951 |
| 2018 | $447 | $15,038 | $3,087 | $11,951 |
| 2017 | $500 | $15,038 | $3,087 | $11,951 |
| 2016 | $415 | $15,038 | $3,087 | $11,951 |
| 2015 | $485 | $16,773 | $5,152 | $11,621 |
| 2014 | $467 | $16,773 | $5,152 | $11,621 |
| 2013 | -- | $16,772 | $5,152 | $11,620 |
Source: Public Records
Map
Nearby Homes
- 105 Elm St
- 1204 Wooden Ave
- 4 Carroll Ln
- 1014 Lee Ave
- 916 Logan Ave
- 126 S Liner St
- 200 W Oak St
- 136 Summit St
- Lot 81 Battle Bluff Dr
- Lot 80 Battle Bluff Dr
- Lot 79 Battle Bluff Dr
- 405 Miami Ave
- 806 Mcfarland Ave
- 816 Indian Ave
- 164 S Mission Ridge Dr
- 115 Beech St
- 189 Leinbach Rd
- 328 S Mission Ridge Dr
- 0 Dempsey Ln Unit 1504691
- 515 Hogan Rd
- 1204 1/2 Mcfarland Ave
- 1204 Mcfarland Ave
- 109 Elm St
- 1115 Mcfarland Ave
- 107 Elm St
- 1201 Mcfarland Ave
- 103 Elm St
- 1113 Mcfarland Ave
- 101 Allgood St
- 1109 Mcfarland Ave
- 1111 Mcfarland Ave
- 108 Elm St
- 108 Elm St
- 1107 Mcfarland Ave
- 1204 Logan Ave
- 103 Cedar St
- 1206 Logan Ave
- 1208 Logan Ave
- 1202 Logan Ave
- 1100 Mcfarland Ave