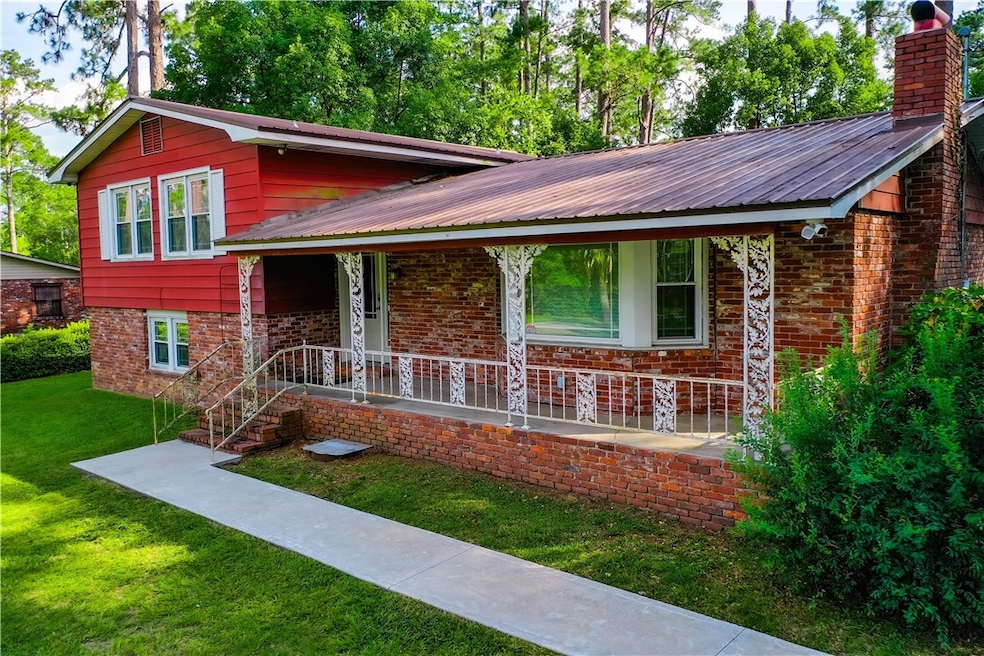
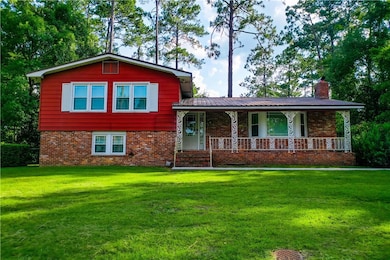
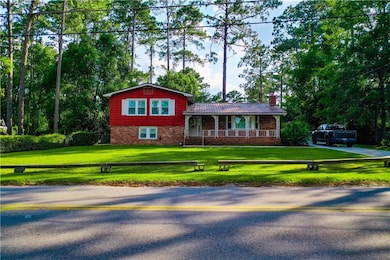
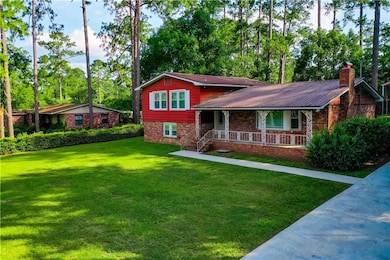
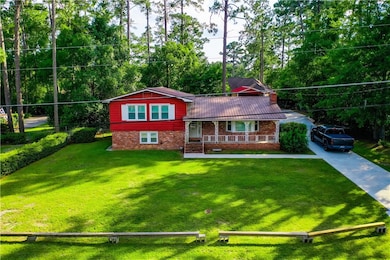
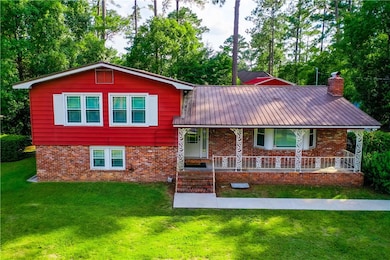
1206 Morningside Dr Waycross, GA 31501
Estimated payment $1,144/month
Highlights
- Wood Flooring
- Covered Patio or Porch
- Central Heating and Cooling System
- No HOA
- Breakfast Area or Nook
- Wood Siding
About This Home
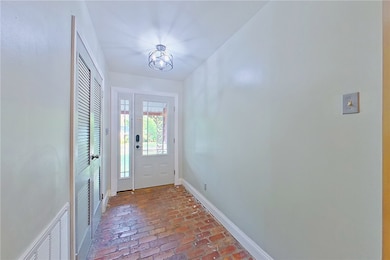
Here's a fixer-upper with great potential - ideal for FHA 203K Rehab Buyers or Investors!!! Looking for a home with solid bones and room to make it your own? This tri-level home is perfect for buyers who aren't afraid of a little TLC or investors seeking their next profitable project. Priced to sell and with a newer metal roof, this property is a fantastic candidate for a FHA 203K renovation loan, allowing you to finance the updates right into your mortgage. Step inside from the front porch into a foyer that leads to the kitchen, which includes all appliances, and opens into a designated dining area. The spacious living room features a cozy wood-burning fireplace, makes great space for relaxing or entertaining. Upstairs you will find 3 bedrooms and 2 baths, including the primary suite with bath with shower only. The basement level is currently unfinished, but includes living space, 1 bedroom, full bath and laundry area - offering excellent potential for expansion or multi-generational living. Enjoy the outdoors with a covered back porch and a fenced backyard - perfect for pets or play. As a bonus, there's a newer metal outbuilding on the property that's ideal for storage or a workshop. This home will require some updating, but it's priced to give the next owner room to renovate and build equity. It should qualify for conventional financing or the FHA 203K rehab loan - don't miss out on this opportunity!!!
Home Details
Home Type
- Single Family
Est. Annual Taxes
- $3,637
Year Built
- Built in 1959
Home Design
- Brick Exterior Construction
- Metal Roof
- Wood Siding
- Vinyl Siding
Interior Spaces
- 2,224 Sq Ft Home
- Wood Burning Fireplace
- Living Room with Fireplace
- Wood Flooring
Kitchen
- Breakfast Area or Nook
- Oven
- Range
- Dishwasher
Bedrooms and Bathrooms
- 4 Bedrooms
- 3 Full Bathrooms
Parking
- 2 Parking Spaces
- Driveway
Additional Features
- Covered Patio or Porch
- 0.36 Acre Lot
- Central Heating and Cooling System
Community Details
- No Home Owners Association
- Cherokee Heights Subdivision
Listing and Financial Details
- Assessor Parcel Number WA2003 096
Map
Home Values in the Area
Average Home Value in this Area
Tax History
| Year | Tax Paid | Tax Assessment Tax Assessment Total Assessment is a certain percentage of the fair market value that is determined by local assessors to be the total taxable value of land and additions on the property. | Land | Improvement |
|---|---|---|---|---|
| 2024 | $3,637 | $91,534 | $6,480 | $85,054 |
| 2023 | $3,156 | $65,805 | $3,770 | $62,035 |
| 2022 | $2,622 | $65,805 | $3,770 | $62,035 |
| 2021 | $2,298 | $53,151 | $3,770 | $49,381 |
| 2020 | $2,316 | $53,151 | $3,770 | $49,381 |
| 2019 | $1,650 | $40,715 | $3,770 | $36,945 |
| 2018 | $1,755 | $39,333 | $3,770 | $35,563 |
| 2017 | $1,715 | $39,333 | $3,770 | $35,563 |
| 2016 | $1,715 | $39,333 | $3,770 | $35,563 |
| 2015 | $1,727 | $39,332 | $3,770 | $35,563 |
| 2014 | $1,725 | $39,332 | $3,770 | $35,563 |
| 2013 | -- | $39,332 | $3,769 | $35,562 |
Property History
| Date | Event | Price | List to Sale | Price per Sq Ft |
|---|---|---|---|---|
| 08/22/2025 08/22/25 | Pending | -- | -- | -- |
| 06/25/2025 06/25/25 | For Sale | $159,900 | -- | $72 / Sq Ft |
Purchase History
| Date | Type | Sale Price | Title Company |
|---|---|---|---|
| Warranty Deed | $93,280 | -- | |
| Warranty Deed | -- | -- | |
| Warranty Deed | $32,500 | -- | |
| Foreclosure Deed | -- | -- | |
| Deed | $108,000 | -- |
Mortgage History
| Date | Status | Loan Amount | Loan Type |
|---|---|---|---|
| Open | $91,590 | FHA | |
| Previous Owner | $86,400 | New Conventional | |
| Previous Owner | $21,600 | New Conventional |
Source: Golden Isles Association of REALTORS®
MLS Number: 1654884
APN: WA2003-096
Disclaimer: Certain information contained herein is derived from information provided by parties other than Homes.com. All information provided is deemed reliable, but is not guaranteed to be accurate and should be independently verified.
![]() IDX information is provided exclusively for personal, non-commercial use, and may not be used for any purpose other than to identify prospective properties consumers may be interested in purchasing. Information is deemed reliable but not guaranteed.
IDX information is provided exclusively for personal, non-commercial use, and may not be used for any purpose other than to identify prospective properties consumers may be interested in purchasing. Information is deemed reliable but not guaranteed.
- 1703 Rainbow Dr
- 1621 Camellia Dr
- 1715 City Blvd
- Lot 3 City Blvd
- 1103 Kontz Ave
- 1400 E Cherokee Dr
- 1011 Cherokee Cir
- 2108 Screven Ave
- 00 Seminole Trail
- 1617 Moss Creek Rd
- 1002 Cherokee Cir
- 1502 Seminole Trail
- 1622 Booth St
- 1504 Danora Dr
- 1001 Coral Rd
- 1009 Euclid Ave
- 1100 Euclid Ave
- 2706 Alice St
- 907 Euclid Ave
- 1002 Baltimore Ave
