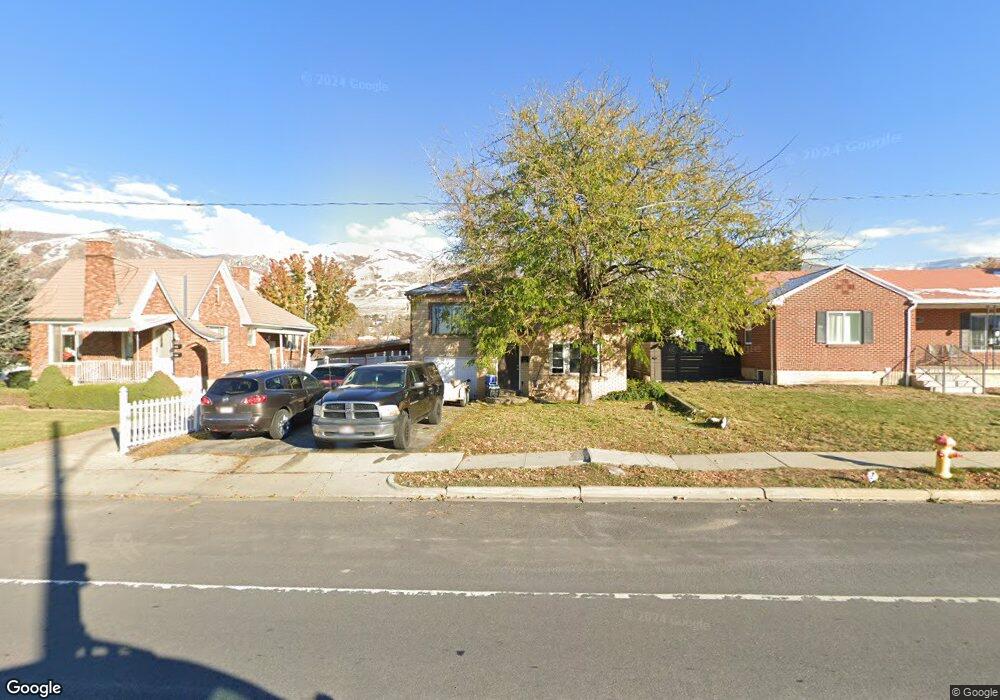
1206 N Main St Bountiful, UT 84010
Estimated Value: $441,000 - $545,000
3
Beds
1
Bath
1,988
Sq Ft
$259/Sq Ft
Est. Value
About This Home
This home is located at 1206 N Main St, Bountiful, UT 84010 and is currently estimated at $515,254, approximately $259 per square foot. 1206 N Main St is a home located in Davis County with nearby schools including Tolman School, Centerville Jr High, and Viewmont High School.
Ownership History
Date
Name
Owned For
Owner Type
Purchase Details
Closed on
Jan 26, 2009
Sold by
Larsen Jeannie A
Bought by
Backwater Investments Llc
Current Estimated Value
Purchase Details
Closed on
Feb 7, 2007
Sold by
Robinson Wallace and Robinson Diane
Bought by
Larsen Jeannie
Purchase Details
Closed on
Jan 9, 2007
Sold by
Robinson Betty and Jamison Betty
Bought by
Robinson Wallace and Robinson Diane
Purchase Details
Closed on
Oct 21, 1998
Sold by
Robinson Carlos Stoffel
Bought by
Robinson Wallace and Robinson Diane
Home Financials for this Owner
Home Financials are based on the most recent Mortgage that was taken out on this home.
Original Mortgage
$60,000
Interest Rate
6.84%
Mortgage Type
Seller Take Back
Create a Home Valuation Report for This Property
The Home Valuation Report is an in-depth analysis detailing your home's value as well as a comparison with similar homes in the area
Purchase History
| Date | Buyer | Sale Price | Title Company |
|---|---|---|---|
| Backwater Investments Llc | -- | None Available | |
| Larsen Jeannie | -- | Inwest Title Services Inc | |
| Robinson Wallace | -- | Inwest Title Services Inc | |
| Robinson Wallace | -- | Bonneville Title Company Inc |
Source: Public Records
Mortgage History
| Date | Status | Borrower | Loan Amount |
|---|---|---|---|
| Previous Owner | Robinson Wallace | $60,000 |
Source: Public Records
Tax History
| Year | Tax Paid | Tax Assessment Tax Assessment Total Assessment is a certain percentage of the fair market value that is determined by local assessors to be the total taxable value of land and additions on the property. | Land | Improvement |
|---|---|---|---|---|
| 2025 | $3,296 | $230,450 | $159,428 | $71,022 |
| 2024 | $3,161 | $223,299 | $170,648 | $52,651 |
| 2023 | $3,425 | $254,300 | $225,111 | $29,189 |
| 2022 | $3,075 | $401,000 | $388,450 | $12,550 |
| 2021 | $2,875 | $325,000 | $281,139 | $43,861 |
| 2020 | $2,490 | $265,000 | $227,193 | $37,807 |
| 2019 | $2,394 | $257,000 | $117,490 | $139,510 |
| 2018 | $2,172 | $230,000 | $114,214 | $115,786 |
| 2016 | $1,939 | $111,265 | $74,628 | $36,637 |
| 2015 | $1,885 | $101,750 | $74,628 | $27,122 |
| 2014 | $1,924 | $109,565 | $74,628 | $34,937 |
| 2013 | -- | $108,009 | $65,984 | $42,025 |
Source: Public Records
Map
Nearby Homes
- 1220 N Main St
- 1190 N Main St
- 1170 N Main St
- 1270 N Main St
- 165 E 1100 N Unit 30
- 165 E 1100 N Unit 29
- 165 E 1100 N Unit 28
- 165 E 1100 N Unit 27
- 165 E 1100 N Unit 26
- 165 E 1100 N Unit 25
- 165 E 1100 N Unit 24
- 165 E 1100 N Unit 23
- 165 E 1100 N Unit 22
- 165 E 1100 N Unit 20
- 165 E 1100 N Unit 19
- 165 E 1100 N
- 165 E 1100 N Unit 17
- 165 E 1100 N Unit 16
- 165 E 1100 N Unit 15
- 165 E 1100 N Unit 14
Your Personal Tour Guide
Ask me questions while you tour the home.