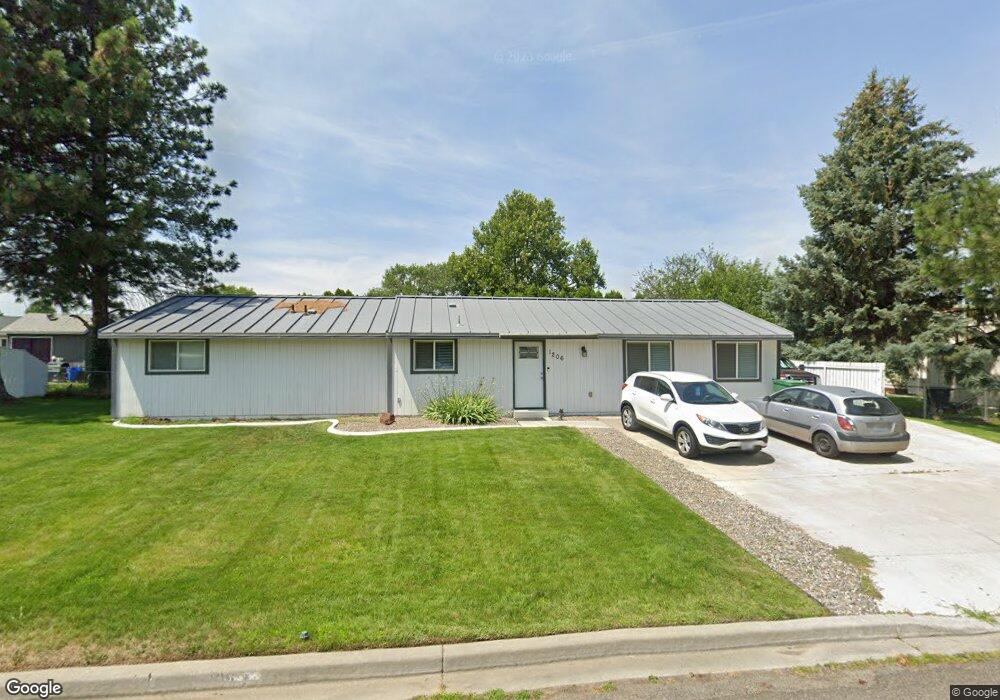
1206 S Johnson St Unit AWESOME HOME, AWESOM Kennewick, WA 99338
Estimated Value: $348,322 - $397,000
3
Beds
2
Baths
1,584
Sq Ft
$241/Sq Ft
Est. Value
About This Home
This home is located at 1206 S Johnson St Unit AWESOME HOME, AWESOM, Kennewick, WA 99338 and is currently estimated at $381,331, approximately $240 per square foot. 1206 S Johnson St Unit AWESOME HOME, AWESOM is a home located in Benton County with nearby schools including Lincoln Elementary School, Southridge High School, and Bethlehem Lutheran School.
Ownership History
Date
Name
Owned For
Owner Type
Purchase Details
Closed on
Jul 23, 2016
Sold by
Ricci Brandon and Ricci Iliana
Bought by
Brown Johnna L
Current Estimated Value
Home Financials for this Owner
Home Financials are based on the most recent Mortgage that was taken out on this home.
Original Mortgage
$10,000
Outstanding Balance
$7,999
Interest Rate
3.56%
Mortgage Type
Negative Amortization
Estimated Equity
$373,332
Purchase Details
Closed on
Jan 16, 2015
Sold by
Jms Construction Inc
Bought by
Ricci Brandon and Ricci Iliana
Home Financials for this Owner
Home Financials are based on the most recent Mortgage that was taken out on this home.
Original Mortgage
$132,900
Interest Rate
3.82%
Mortgage Type
New Conventional
Create a Home Valuation Report for This Property
The Home Valuation Report is an in-depth analysis detailing your home's value as well as a comparison with similar homes in the area
Home Values in the Area
Average Home Value in this Area
Purchase History
| Date | Buyer | Sale Price | Title Company |
|---|---|---|---|
| Brown Johnna L | $176,700 | Benton Franklin Title Co | |
| Ricci Brandon | $139,619 | Stewart Title Company |
Source: Public Records
Mortgage History
| Date | Status | Borrower | Loan Amount |
|---|---|---|---|
| Open | Brown Johnna L | $10,000 | |
| Open | Brown Johnna L | $171,399 | |
| Previous Owner | Ricci Brandon | $132,900 |
Source: Public Records
Tax History Compared to Growth
Tax History
| Year | Tax Paid | Tax Assessment Tax Assessment Total Assessment is a certain percentage of the fair market value that is determined by local assessors to be the total taxable value of land and additions on the property. | Land | Improvement |
|---|---|---|---|---|
| 2024 | $2,470 | $321,760 | $70,000 | $251,760 |
| 2023 | $2,470 | $307,370 | $70,000 | $237,370 |
| 2022 | $2,172 | $242,640 | $70,000 | $172,640 |
| 2021 | $1,915 | $221,050 | $70,000 | $151,050 |
| 2020 | $1,892 | $188,660 | $35,000 | $153,660 |
| 2019 | $1,641 | $178,420 | $35,000 | $143,420 |
| 2018 | $1,744 | $157,930 | $35,000 | $122,930 |
| 2017 | $1,592 | $137,440 | $35,000 | $102,440 |
| 2016 | $2,012 | $137,440 | $35,000 | $102,440 |
| 2015 | $1,947 | $137,440 | $35,000 | $102,440 |
| 2014 | -- | $131,690 | $30,000 | $101,690 |
| 2013 | -- | $131,690 | $30,000 | $101,690 |
Source: Public Records
Map
Nearby Homes
- 1103 S Johnson St
- 3324 W 19th Ave Unit 186
- 3324 W 19th Ave Unit 111
- 3324 W 19th Ave Unit 14
- 3324 W 19th Ave Unit 138
- 3572 S 11th Place
- 943 S Keller St
- 1716 S Huntington Place
- 3500 W 6th Place Unit Lot18
- 3430 W 6th Place
- 3416 W 6th Place
- 604 S Huntington Place
- 1622 S Dennis Place
- 3701 W 20th Ave
- 2906 W 7th Ave Unit 74
- 2917 W 19th Ave Unit 1
- 2917 W 19th Ave Unit 154
- 2917 W 19th Ave Unit 103
- 509 S Johnson St
- 577 S Quillan Place
- 1206 S Johnson St Unit MULTIPLE OFFERS-see
- 1206 S Johnson St
- 1202 S Johnson St Unit Motivated seller red
- 1202 S Johnson St Unit Every room is soooo
- 1210 S Johnson St
- 1207 S Johnson St
- 1203 S Johnson St
- 3325 W 12th Ave
- 3231 W 13th Ave
- 3222 W 13th Ave
- 1205 S Keller Place
- 1223 S Keller Place
- 1223 S Keller Place Unit Cherry Glen
- 3227 W 13th Ave
- 3223 W 12th Ave
- 1241 S Keller Place Unit Cherry Glen
- 1187 S Keller Place
- 1106 S Johnson St
- 3324 W 12th Ave
- 1107 S Johnson St