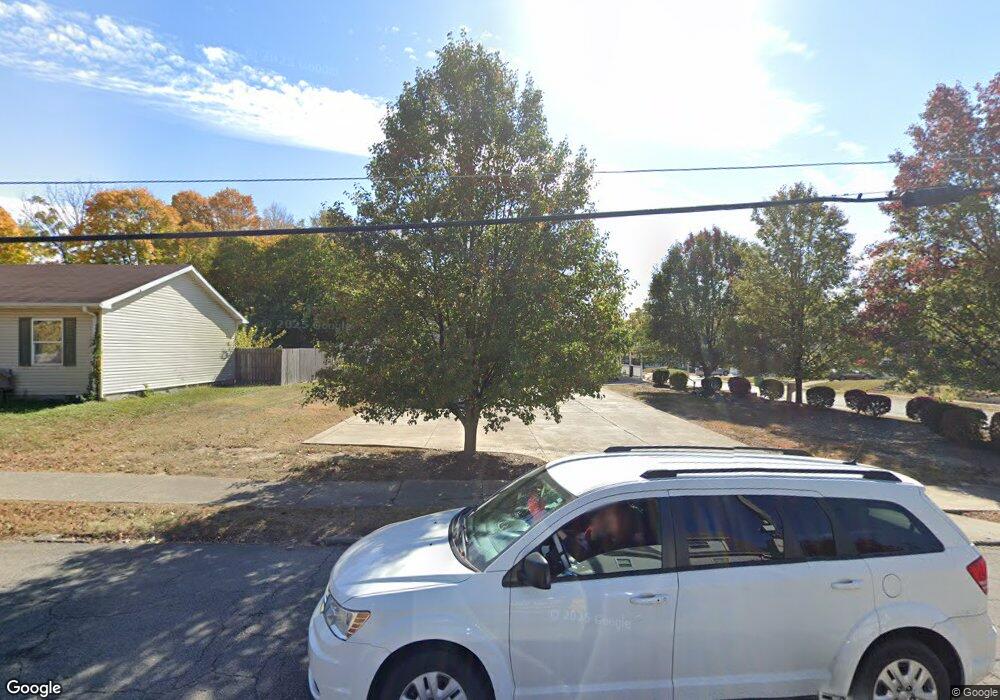
1206 S Main St New Castle, IN 47362
Estimated Value: $188,000 - $281,000
4
Beds
2
Baths
2,571
Sq Ft
$95/Sq Ft
Est. Value
About This Home
This home is located at 1206 S Main St, New Castle, IN 47362 and is currently estimated at $243,249, approximately $94 per square foot. 1206 S Main St is a home with nearby schools including Agape Learning Center.
Ownership History
Date
Name
Owned For
Owner Type
Purchase Details
Closed on
Jul 22, 2022
Sold by
Igroup Llc
Bought by
Hill Oxford Three Llc
Current Estimated Value
Purchase Details
Closed on
Mar 22, 2007
Sold by
M L Taylor Construction Inc
Bought by
Cardinal Service Management Inc
Home Financials for this Owner
Home Financials are based on the most recent Mortgage that was taken out on this home.
Original Mortgage
$350,000
Interest Rate
6.27%
Mortgage Type
Purchase Money Mortgage
Create a Home Valuation Report for This Property
The Home Valuation Report is an in-depth analysis detailing your home's value as well as a comparison with similar homes in the area
Home Values in the Area
Average Home Value in this Area
Purchase History
| Date | Buyer | Sale Price | Title Company |
|---|---|---|---|
| Hill Oxford Three Llc | $281,513 | Fidelity National Title Compan | |
| Cardinal Service Management Inc | -- | None Available |
Source: Public Records
Mortgage History
| Date | Status | Borrower | Loan Amount |
|---|---|---|---|
| Previous Owner | Cardinal Service Management Inc | $350,000 |
Source: Public Records
Tax History Compared to Growth
Tax History
| Year | Tax Paid | Tax Assessment Tax Assessment Total Assessment is a certain percentage of the fair market value that is determined by local assessors to be the total taxable value of land and additions on the property. | Land | Improvement |
|---|---|---|---|---|
| 2024 | $4,981 | $236,200 | $25,700 | $210,500 |
| 2023 | $4,748 | $237,400 | $56,500 | $180,900 |
| 2022 | $3,931 | $194,600 | $28,300 | $166,300 |
| 2021 | $3,803 | $188,200 | $24,600 | $163,600 |
| 2020 | $3,789 | $183,000 | $24,600 | $158,400 |
| 2019 | $3,770 | $180,600 | $24,600 | $156,000 |
| 2018 | $3,672 | $176,300 | $22,300 | $154,000 |
| 2017 | $3,705 | $177,900 | $22,300 | $155,600 |
| 2016 | $3,615 | $174,400 | $21,900 | $152,500 |
| 2014 | $3,543 | $174,600 | $25,700 | $148,900 |
| 2013 | $3,543 | $167,100 | $25,000 | $142,100 |
Source: Public Records
Map
Nearby Homes