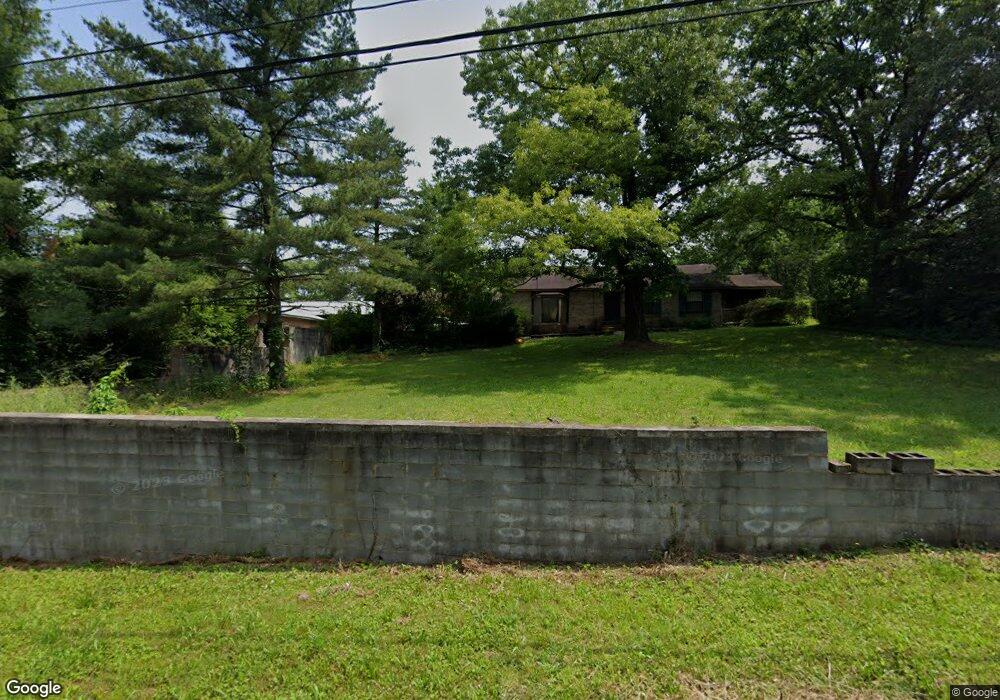
1206 Salem Rd Rossville, GA 30741
Estimated Value: $198,000 - $295,939
--
Bed
2
Baths
2,378
Sq Ft
$109/Sq Ft
Est. Value
About This Home
This home is located at 1206 Salem Rd, Rossville, GA 30741 and is currently estimated at $258,985, approximately $108 per square foot. 1206 Salem Rd is a home located in Walker County with nearby schools including Stone Creek Elementary School, Rossville Middle School, and Ridgeland High School.
Ownership History
Date
Name
Owned For
Owner Type
Purchase Details
Closed on
Nov 18, 2005
Sold by
Not Provided
Bought by
Fowler William D and Fowler Amy
Current Estimated Value
Home Financials for this Owner
Home Financials are based on the most recent Mortgage that was taken out on this home.
Original Mortgage
$77,000
Outstanding Balance
$42,190
Interest Rate
6.04%
Mortgage Type
New Conventional
Estimated Equity
$216,795
Purchase Details
Closed on
Dec 19, 2003
Sold by
Baldwin Virgil L
Bought by
Fowler William and Wf Wilma
Purchase Details
Closed on
Nov 13, 2002
Sold by
Baldwin Virgil L and Baldwin Teresa D
Bought by
Baldwin Virgil L
Purchase Details
Closed on
Dec 2, 1987
Sold by
Graham James R and Wf Linda
Bought by
Baldwin Virgil L and Baldwin Teresa D
Purchase Details
Closed on
May 21, 1985
Sold by
Goins Gordon D and Goins Christine E
Bought by
Graham James R and Wf Linda
Purchase Details
Closed on
Jan 1, 1972
Bought by
Goins Gordon D and Goins Christine E
Create a Home Valuation Report for This Property
The Home Valuation Report is an in-depth analysis detailing your home's value as well as a comparison with similar homes in the area
Home Values in the Area
Average Home Value in this Area
Purchase History
| Date | Buyer | Sale Price | Title Company |
|---|---|---|---|
| Fowler William D | -- | -- | |
| Fowler William | $58,000 | -- | |
| Baldwin Virgil L | -- | -- | |
| Baldwin Virgil L | -- | -- | |
| Graham James R | $26,800 | -- | |
| Goins Gordon D | -- | -- |
Source: Public Records
Mortgage History
| Date | Status | Borrower | Loan Amount |
|---|---|---|---|
| Open | Fowler William D | $77,000 |
Source: Public Records
Tax History Compared to Growth
Tax History
| Year | Tax Paid | Tax Assessment Tax Assessment Total Assessment is a certain percentage of the fair market value that is determined by local assessors to be the total taxable value of land and additions on the property. | Land | Improvement |
|---|---|---|---|---|
| 2024 | $2,144 | $91,162 | $10,194 | $80,968 |
| 2023 | $2,069 | $85,772 | $8,090 | $77,682 |
| 2022 | $1,883 | $72,803 | $3,453 | $69,350 |
| 2021 | $1,822 | $63,581 | $3,453 | $60,128 |
| 2020 | $1,788 | $60,055 | $3,453 | $56,602 |
| 2019 | $1,818 | $60,055 | $3,453 | $56,602 |
| 2018 | $1,589 | $60,055 | $3,453 | $56,602 |
| 2017 | $2,084 | $63,430 | $6,828 | $56,602 |
| 2016 | $1,228 | $46,885 | $6,828 | $40,057 |
| 2015 | $1,459 | $53,033 | $4,712 | $48,321 |
| 2014 | $1,353 | $53,033 | $4,712 | $48,321 |
| 2013 | -- | $53,486 | $4,712 | $48,774 |
Source: Public Records
Map
Nearby Homes
- 5413 Lee Ave
- 0 Slayton Ave Unit 1504633
- Lots 7 & 5 Slayton Ave
- 5342 Slayton Ave
- 1317 Thomas Ave Unit 8
- 1317 Thomas Ave
- 1297 Thomas Ave
- 5343 Usher Dr
- 5720 Saint Elmo Ave
- 5220 Fagan St
- 5422 Saint Elmo Ave
- 1014 Wilson Rd
- 1402 W 53rd St
- 1303 W 53rd St
- 5601 Alabama Ave
- 5405 Saint Elmo Ave
- 5301 Saint Elmo Ave
- 53 Charlsie Trail Unit 12
- 5107 Beulah Ave
- 4913 Virginia Ave