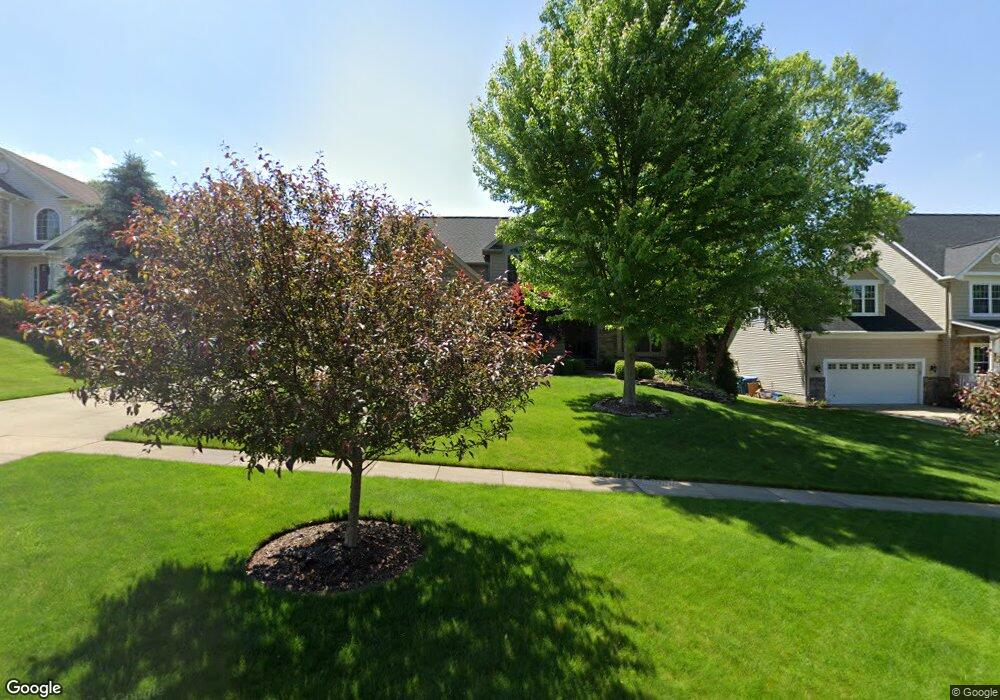
1206 Singleton Dr Copley, OH 44321
Estimated Value: $462,922 - $520,000
3
Beds
3
Baths
2,506
Sq Ft
$200/Sq Ft
Est. Value
About This Home
This home is located at 1206 Singleton Dr, Copley, OH 44321 and is currently estimated at $502,231, approximately $200 per square foot. 1206 Singleton Dr is a home located in Summit County with nearby schools including Copley-Fairlawn Middle School, Copley High School, and Spring Garden Waldorf School.
Ownership History
Date
Name
Owned For
Owner Type
Purchase Details
Closed on
Aug 29, 2018
Sold by
Uber Lawrence S and Uber Cherie A
Bought by
Uber Lawrence S and Uber Cherie A
Current Estimated Value
Purchase Details
Closed on
Aug 17, 2005
Sold by
Frank Michaels Homes Inc
Bought by
Uber Lawrence S and Uber Cheri A
Home Financials for this Owner
Home Financials are based on the most recent Mortgage that was taken out on this home.
Original Mortgage
$280,500
Interest Rate
5.8%
Mortgage Type
Construction
Purchase Details
Closed on
Aug 3, 2005
Sold by
Fc Creekstone Llc
Bought by
Frank Michaels Homes Inc
Home Financials for this Owner
Home Financials are based on the most recent Mortgage that was taken out on this home.
Original Mortgage
$280,500
Interest Rate
5.8%
Mortgage Type
Construction
Create a Home Valuation Report for This Property
The Home Valuation Report is an in-depth analysis detailing your home's value as well as a comparison with similar homes in the area
Home Values in the Area
Average Home Value in this Area
Purchase History
| Date | Buyer | Sale Price | Title Company |
|---|---|---|---|
| Uber Lawrence S | -- | None Available | |
| Uber Lawrence S | $77,400 | Chicago Title Insurance Comp | |
| Frank Michaels Homes Inc | $55,200 | Chicago Title Insurance Co |
Source: Public Records
Mortgage History
| Date | Status | Borrower | Loan Amount |
|---|---|---|---|
| Closed | Uber Lawrence S | $280,500 |
Source: Public Records
Tax History
| Year | Tax Paid | Tax Assessment Tax Assessment Total Assessment is a certain percentage of the fair market value that is determined by local assessors to be the total taxable value of land and additions on the property. | Land | Improvement |
|---|---|---|---|---|
| 2024 | $7,127 | $131,530 | $22,449 | $109,081 |
| 2023 | $7,127 | $131,530 | $22,449 | $109,081 |
| 2022 | $7,555 | $114,374 | $19,520 | $94,854 |
| 2021 | $6,983 | $114,374 | $19,520 | $94,854 |
| 2020 | $6,820 | $114,370 | $19,520 | $94,850 |
| 2019 | $6,579 | $97,250 | $19,520 | $77,730 |
| 2018 | $6,131 | $97,250 | $19,520 | $77,730 |
| 2017 | $6,034 | $97,250 | $19,520 | $77,730 |
| 2016 | $6,026 | $91,860 | $19,520 | $72,340 |
| 2015 | $6,034 | $91,860 | $19,520 | $72,340 |
| 2014 | $5,993 | $91,860 | $19,520 | $72,340 |
| 2013 | $5,834 | $93,400 | $19,520 | $73,880 |
Source: Public Records
Map
Nearby Homes
- 3795 N Sunnyfield Dr
- 941 S Hametown Rd
- 3686 S Sunnyfield Dr
- 3984 Palace Way
- 4180 Castle Ridge
- 519 Cheswyck Ct
- 4201 Meadowcreek Ln
- 4038 Gardiner Run
- 4388 Wedgewood Dr
- 5251 Fairington Ave
- 721 S Cleveland Massillon Rd
- 316 Kelsey Dr
- 386 Caleb Dr
- 522 Robinwood Ln Unit I
- V/L - 6 Acres Ridgewood Rd
- 3241 Ridgewood Rd
- 3700 Tamarisk Dr
- 3800 Rosemont Blvd Unit 111B
- 3800 Rosemont Blvd Unit 113D
- 3800 Rosemont Blvd Unit 116 D
- 1198 Singleton Dr
- 1214 Singleton Dr
- 1197 Jonah Dr
- 1190 Singleton Dr
- 1189 Jonah Dr
- 1228 Singleton Dr
- 1203 Singleton Dr
- 1211 Singleton Dr
- 99 S/L Jonah Dr
- 1195 Singleton Dr
- 1219 Singleton Dr
- 1181 Jonah Dr
- 1182 Singleton Dr
- 1173 Jonah Dr
- 1187 Singleton Dr
- 1227 Singleton Dr
- 1182 Jonah Dr
- 1165 Jonah Dr
- 3945 Bosworth Dr
- 1174 Singleton Dr