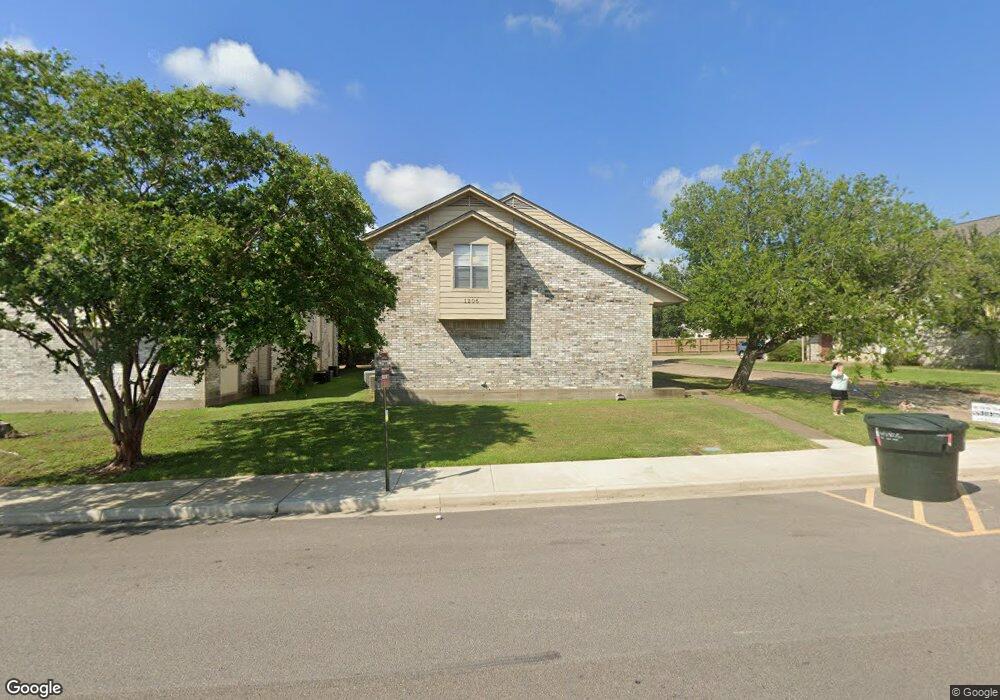
1206 Spring Loop Unit AD College Station, TX 77840
Estimated Value: $389,000 - $696,000
8
Beds
6
Baths
3,200
Sq Ft
$158/Sq Ft
Est. Value
About This Home
This home is located at 1206 Spring Loop Unit AD, College Station, TX 77840 and is currently estimated at $507,000, approximately $158 per square foot. 1206 Spring Loop Unit AD is a home located in Brazos County with nearby schools including College Hills Elementary School, A&M Consolidated Middle School, and Oakwood Intermediate School.
Ownership History
Date
Name
Owned For
Owner Type
Purchase Details
Closed on
Jun 24, 2016
Sold by
Cline Raymond E
Bought by
Cline Barbara A
Current Estimated Value
Home Financials for this Owner
Home Financials are based on the most recent Mortgage that was taken out on this home.
Original Mortgage
$161,250
Outstanding Balance
$127,706
Interest Rate
3.42%
Mortgage Type
Seller Take Back
Estimated Equity
$379,294
Purchase Details
Closed on
Jul 7, 2008
Sold by
Ball Scott P and Bradshaw Janice L
Bought by
Cline Raymond E
Home Financials for this Owner
Home Financials are based on the most recent Mortgage that was taken out on this home.
Original Mortgage
$161,250
Interest Rate
6.11%
Mortgage Type
Purchase Money Mortgage
Create a Home Valuation Report for This Property
The Home Valuation Report is an in-depth analysis detailing your home's value as well as a comparison with similar homes in the area
Purchase History
| Date | Buyer | Sale Price | Title Company |
|---|---|---|---|
| Cline Barbara A | -- | None Available | |
| Cline Raymond E | -- | University Title Company |
Source: Public Records
Mortgage History
| Date | Status | Borrower | Loan Amount |
|---|---|---|---|
| Open | Cline Barbara A | $161,250 | |
| Closed | Cline Raymond E | $161,250 |
Source: Public Records
Tax History
| Year | Tax Paid | Tax Assessment Tax Assessment Total Assessment is a certain percentage of the fair market value that is determined by local assessors to be the total taxable value of land and additions on the property. | Land | Improvement |
|---|---|---|---|---|
| 2025 | $6,476 | $412,034 | $62,000 | $350,034 |
| 2024 | $6,476 | $339,828 | $61,000 | $278,828 |
| 2023 | $6,476 | $389,148 | $60,500 | $328,648 |
| 2022 | $7,021 | $329,294 | $55,000 | $274,294 |
| 2021 | $5,995 | $265,410 | $55,000 | $210,410 |
| 2020 | $6,195 | $272,793 | $55,000 | $217,793 |
| 2019 | $5,268 | $222,940 | $55,000 | $167,940 |
| 2018 | $5,149 | $216,310 | $50,000 | $166,310 |
| 2017 | $5,154 | $218,990 | $50,000 | $168,990 |
| 2016 | $5,126 | $217,820 | $50,000 | $167,820 |
Source: Public Records
Map
Nearby Homes
- 1221 April Bloom Unit AB
- 127 Forest Dr
- 132 Forest Dr
- 164 Forest Drive Loop
- 167 Forest Dr
- 250 Forest Dr
- 336 Forest Dr
- 401 Park Rd Unit A-B
- 1000 Spring Loop Unit 2103
- 1000 Spring Loop Unit 1806
- 1000 Spring Loop Unit 2105
- 1000 Spring Loop Unit 1801
- 1000 Spring Loop Unit 2003
- 1000 Spring Loop Unit 1207
- 410 Forest Dr
- 309 Forest Dr
- 400 Forest Dr
- 29 Forest Dr Unit CS
- 204 Forest Dr
- 1026 Rose Cir
- 1204 Spring Loop Unit AD
- 1208 Spring Loop Unit AD
- 1202 Spring Loop Unit AD
- 1202 Spring Loop Unit A
- 1202 Spring Loop Unit C
- 1202 Spring Loop Unit D
- 1215 Spring Loop Unit AB
- 1213 Spring Loop Unit AB
- 1213 Spring Loop Unit B
- 1213 Spring Loop Unit A
- 1211 Spring Loop Unit AB
- 1211 Spring Loop Unit B
- 1211 Spring Loop Unit A
- 1224 April Bloom Unit AB
- 1200 Spring Loop Unit AD
- 1200 Spring Loop Unit B
- 1200 Spring Loop Unit A
- 1200 Spring Loop Unit D
- 1209 Spring Loop Unit AB
- 1209 Spring Loop Unit A
Your Personal Tour Guide
Ask me questions while you tour the home.