Estimated Value: $158,000 - $170,000
2
Beds
1
Bath
1,014
Sq Ft
$164/Sq Ft
Est. Value
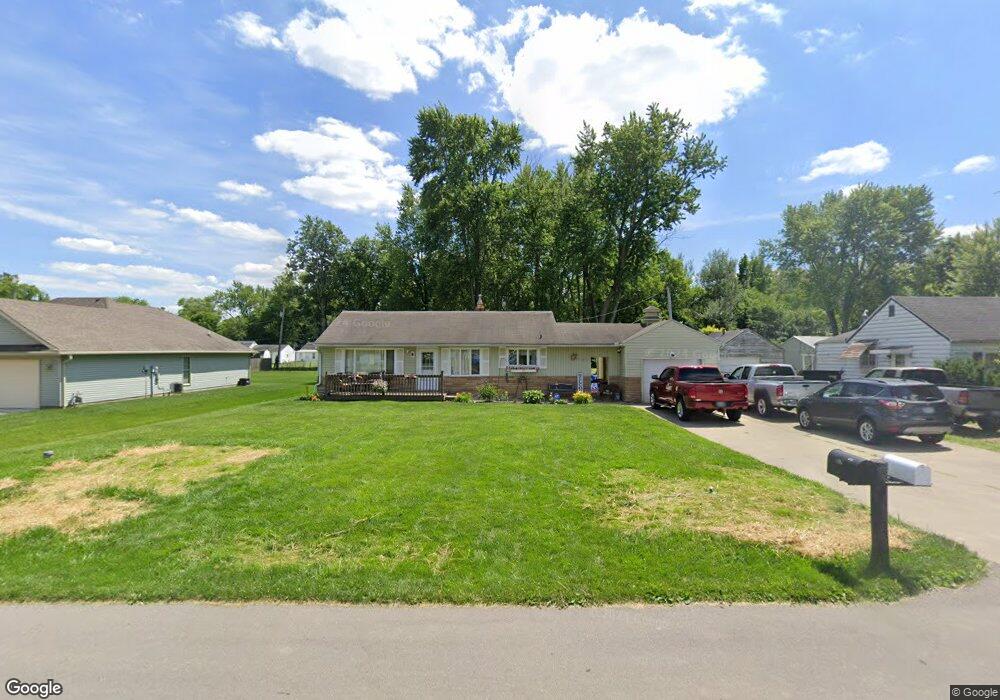
About This Home
This home is located at 1206 Spruce St, Troy, OH 45373 and is currently estimated at $166,178, approximately $163 per square foot. 1206 Spruce St is a home located in Miami County with nearby schools including Heywood Elementary School, Van Cleve Elementary School, and Troy Junior High School.
Ownership History
Date
Name
Owned For
Owner Type
Purchase Details
Closed on
Jan 30, 2018
Sold by
Seitz Princeton
Bought by
Green Sara E
Current Estimated Value
Home Financials for this Owner
Home Financials are based on the most recent Mortgage that was taken out on this home.
Original Mortgage
$65,000
Interest Rate
3.94%
Mortgage Type
New Conventional
Purchase Details
Closed on
Oct 17, 2006
Sold by
Parks Dino
Bought by
Seitz Princeton
Purchase Details
Closed on
Aug 9, 2004
Sold by
Parks Peri
Bought by
Parks Dino
Purchase Details
Closed on
Dec 18, 2000
Sold by
Parks Wili
Bought by
Parks Dino and Parks Peri
Home Financials for this Owner
Home Financials are based on the most recent Mortgage that was taken out on this home.
Original Mortgage
$66,420
Interest Rate
7.8%
Purchase Details
Closed on
Feb 22, 2000
Sold by
Clem Chris L and Clem Beulah V
Bought by
Parks Wili
Purchase Details
Closed on
Jan 1, 1990
Bought by
Clem Chris L
Create a Home Valuation Report for This Property
The Home Valuation Report is an in-depth analysis detailing your home's value as well as a comparison with similar homes in the area
Purchase History
| Date | Buyer | Sale Price | Title Company |
|---|---|---|---|
| Green Sara E | $75,000 | -- | |
| Seitz Princeton | $81,900 | -- | |
| Parks Dino | -- | -- | |
| Parks Dino | $73,800 | -- | |
| Parks Wili | -- | -- | |
| Clem Chris L | -- | -- |
Source: Public Records
Mortgage History
| Date | Status | Borrower | Loan Amount |
|---|---|---|---|
| Previous Owner | Green Sara E | $65,000 | |
| Previous Owner | Parks Wili | $66,420 |
Source: Public Records
Tax History
| Year | Tax Paid | Tax Assessment Tax Assessment Total Assessment is a certain percentage of the fair market value that is determined by local assessors to be the total taxable value of land and additions on the property. | Land | Improvement |
|---|---|---|---|---|
| 2024 | $1,500 | $34,090 | $7,210 | $26,880 |
| 2023 | $1,326 | $34,090 | $7,210 | $26,880 |
| 2022 | $1,111 | $34,090 | $7,210 | $26,880 |
| 2021 | $987 | $28,420 | $6,020 | $22,400 |
| 2020 | $988 | $28,420 | $6,020 | $22,400 |
| 2019 | $997 | $28,420 | $6,020 | $22,400 |
| 2018 | $912 | $24,090 | $6,270 | $17,820 |
| 2017 | $920 | $24,090 | $6,270 | $17,820 |
| 2016 | $909 | $24,090 | $6,270 | $17,820 |
| 2015 | $908 | $23,140 | $6,020 | $17,120 |
| 2014 | $908 | $23,140 | $6,020 | $17,120 |
| 2013 | $914 | $23,140 | $6,020 | $17,120 |
Source: Public Records
Map
Nearby Homes
- 1201 Maple St
- 1141 Dickerson Dr
- 1550 Creekwood Dr
- 920 Old Nursery Trail
- 385 W Ross St
- 229 W Ross St
- 00 W
- 1426 Paul Revere Way Unit B
- 1481 Lantern Ln
- 1479 Lantern Ln Unit 1479
- 2215 Merrimont Dr
- 712 S Clay St
- 0 Lincolnshire Unit 939331
- 1811 Greenbriar Dr
- 410 Armand Dr
- 2320 Seneca Dr
- 405 Lake St
- 2065 S Co Road 25a
- 535 Barnhart Rd
- 2240 Seneca Dr
Your Personal Tour Guide
Ask me questions while you tour the home.