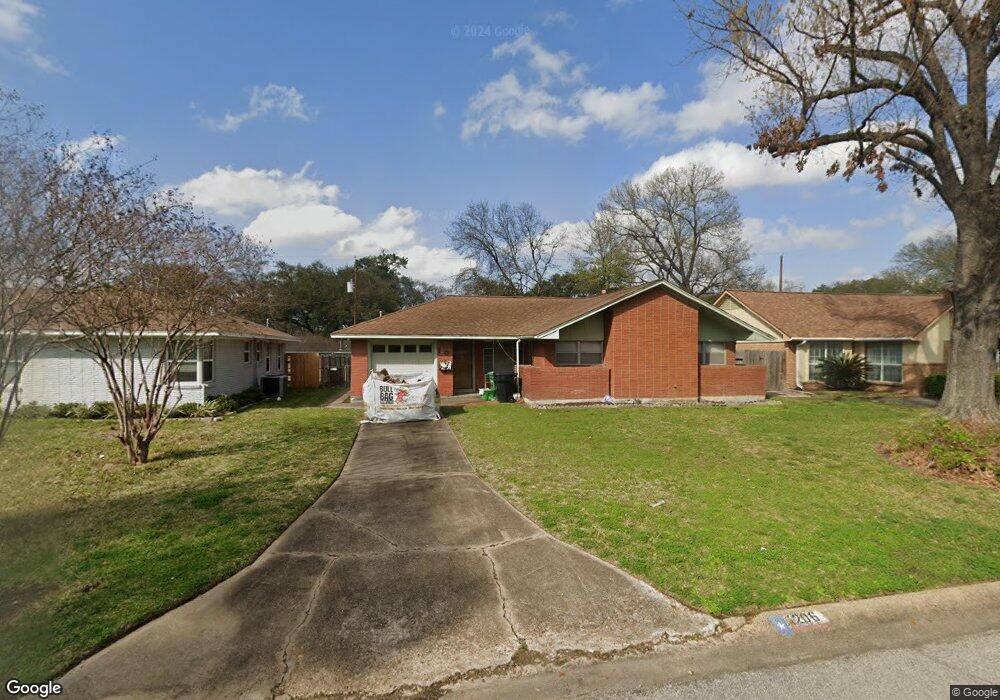
1206 W 30th St Houston, TX 77018
Oak Forest-Garden Oaks NeighborhoodEstimated Value: $377,262 - $415,000
3
Beds
2
Baths
1,595
Sq Ft
$251/Sq Ft
Est. Value
About This Home
This home is located at 1206 W 30th St, Houston, TX 77018 and is currently estimated at $401,066, approximately $251 per square foot. 1206 W 30th St is a home located in Harris County with nearby schools including Garden Oaks Montessori, Frank Black Middle School, and Waltrip High School.
Ownership History
Date
Name
Owned For
Owner Type
Purchase Details
Closed on
Apr 21, 2010
Sold by
Bodger Walter Charles and Bodger Mary Alice Allen
Bought by
Chaput Lisa Nannette and Chaput Jacob Allen
Current Estimated Value
Purchase Details
Closed on
Jun 30, 2004
Sold by
Hill Richard C
Bought by
Bodger Holly J
Home Financials for this Owner
Home Financials are based on the most recent Mortgage that was taken out on this home.
Original Mortgage
$104,800
Interest Rate
6.31%
Mortgage Type
Purchase Money Mortgage
Purchase Details
Closed on
Dec 30, 1997
Sold by
Hickman Audrey Bennight and Hickman Bennight J
Bought by
Hill Richard C
Home Financials for this Owner
Home Financials are based on the most recent Mortgage that was taken out on this home.
Original Mortgage
$54,000
Interest Rate
7.14%
Create a Home Valuation Report for This Property
The Home Valuation Report is an in-depth analysis detailing your home's value as well as a comparison with similar homes in the area
Home Values in the Area
Average Home Value in this Area
Purchase History
| Date | Buyer | Sale Price | Title Company |
|---|---|---|---|
| Chaput Lisa Nannette | -- | None Available | |
| Bodger Holly J | -- | -- | |
| Hill Richard C | -- | -- |
Source: Public Records
Mortgage History
| Date | Status | Borrower | Loan Amount |
|---|---|---|---|
| Previous Owner | Bodger Holly J | $104,800 | |
| Previous Owner | Hill Richard C | $54,000 | |
| Closed | Bodger Holly J | $19,650 |
Source: Public Records
Tax History Compared to Growth
Tax History
| Year | Tax Paid | Tax Assessment Tax Assessment Total Assessment is a certain percentage of the fair market value that is determined by local assessors to be the total taxable value of land and additions on the property. | Land | Improvement |
|---|---|---|---|---|
| 2025 | $1,074 | $342,727 | $277,760 | $64,967 |
| 2024 | $1,074 | $342,727 | $277,760 | $64,967 |
| 2023 | $1,074 | $311,729 | $243,040 | $68,689 |
| 2022 | $1,926 | $299,009 | $208,320 | $90,689 |
| 2021 | $6,252 | $260,573 | $173,600 | $86,973 |
| 2020 | $6,310 | $260,573 | $173,600 | $86,973 |
| 2019 | $6,523 | $257,771 | $173,600 | $84,171 |
| 2018 | $5,137 | $267,361 | $173,600 | $93,761 |
| 2017 | $6,304 | $267,361 | $173,600 | $93,761 |
| 2016 | $5,731 | $267,361 | $173,600 | $93,761 |
| 2015 | $3,692 | $261,846 | $173,600 | $88,246 |
| 2014 | $3,692 | $188,992 | $104,160 | $84,832 |
Source: Public Records
Map
Nearby Homes
- 1226 Stonecrest Dr
- 1119 W 30th St
- 1235 Ansbury Dr
- 1115 Gardendale Dr
- 1041 Gardendale Dr
- 2609 Bevis St
- 2667 Shady Acres Landing
- 2634 Couch St
- 2623 Shady Woods Ln
- 1413 W 26th St
- 1137 W 26th St
- 1121 Beall Landing Ct
- 2543 Bevis St
- 1114 Beall Landing Ct
- 1240 W 26th St
- 1230 W 26th St
- 1135 W 26th St Unit 5
- 3505 Golf Dr Unit D
- 1235 W 25th St
- 1414 W 34th 1/2 St
- 1210 W 30th St
- 1202 W 30th St
- 1207 Stonecrest Dr
- 1214 W 30th St
- 1211 Stonecrest Dr
- 1203 Stonecrest Dr
- 1215 Stonecrest Dr
- 1207 W 30th St
- 1211 W 30th St
- 1218 W 30th St
- 1203 W 30th St
- 1138 W 30th St
- 1215 W 30th St
- 1219 Stonecrest Dr
- 1143 W 30th St
- 1139 Stonecrest Dr
- 1219 W 30th St
- 1222 W 30th St
- 1134 W 30th St
- 1223 Stonecrest Dr