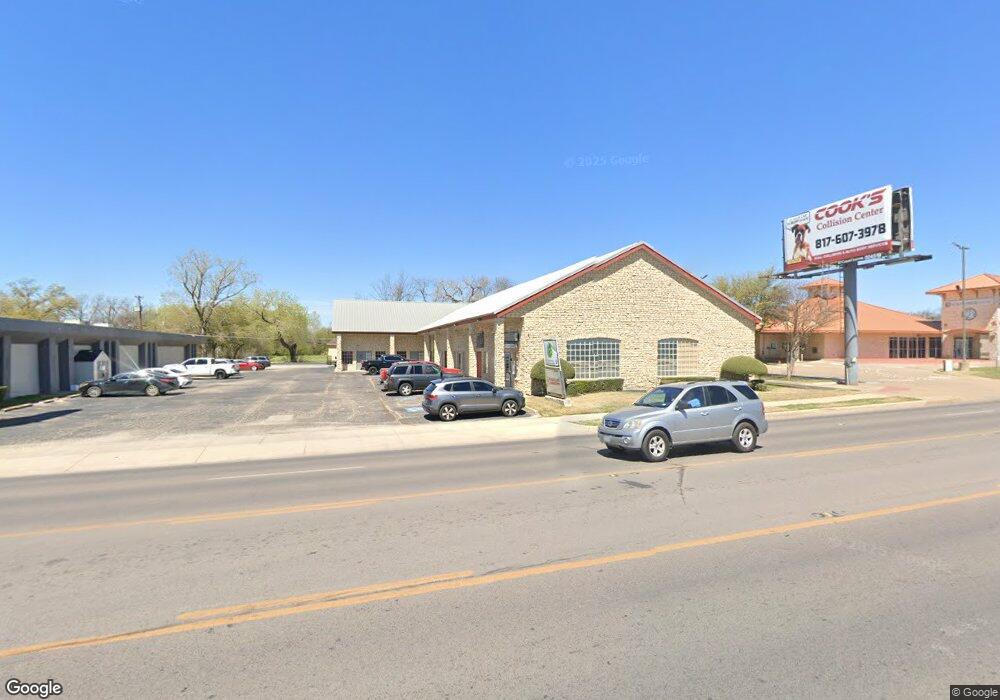
1206 W Henderson St Cleburne, TX 76033
Estimated Value: $1,144,139
--
Bed
--
Bath
9,750
Sq Ft
$117/Sq Ft
Est. Value
About This Home
This home is located at 1206 W Henderson St, Cleburne, TX 76033 and is currently estimated at $1,144,139, approximately $117 per square foot. 1206 W Henderson St is a home located in Johnson County with nearby schools including Coleman Elementary School, A.D. Wheat Middle School, and Cleburne High School.
Ownership History
Date
Name
Owned For
Owner Type
Purchase Details
Closed on
Nov 20, 2015
Sold by
Cletex Retail Investments Llc
Bought by
Klement Texas Ltd
Current Estimated Value
Home Financials for this Owner
Home Financials are based on the most recent Mortgage that was taken out on this home.
Original Mortgage
$1,117,750
Outstanding Balance
$458,486
Interest Rate
3.8%
Mortgage Type
Purchase Money Mortgage
Estimated Equity
$685,653
Purchase Details
Closed on
Jun 7, 2007
Sold by
Twelve Zero Six Llc
Bought by
Cletex Retail Investments Llc
Home Financials for this Owner
Home Financials are based on the most recent Mortgage that was taken out on this home.
Original Mortgage
$1,220,000
Interest Rate
4.83%
Mortgage Type
Purchase Money Mortgage
Create a Home Valuation Report for This Property
The Home Valuation Report is an in-depth analysis detailing your home's value as well as a comparison with similar homes in the area
Home Values in the Area
Average Home Value in this Area
Purchase History
| Date | Buyer | Sale Price | Title Company |
|---|---|---|---|
| Klement Texas Ltd | -- | Banchmark Title Llc | |
| Cletex Retail Investments Llc | -- | Benchmark Title Services Llc |
Source: Public Records
Mortgage History
| Date | Status | Borrower | Loan Amount |
|---|---|---|---|
| Open | Klement Texas Ltd | $1,117,750 | |
| Previous Owner | Cletex Retail Investments Llc | $1,220,000 |
Source: Public Records
Tax History Compared to Growth
Tax History
| Year | Tax Paid | Tax Assessment Tax Assessment Total Assessment is a certain percentage of the fair market value that is determined by local assessors to be the total taxable value of land and additions on the property. | Land | Improvement |
|---|---|---|---|---|
| 2025 | $14,366 | $644,300 | $302,789 | $341,511 |
| 2024 | $14,366 | $644,300 | $302,789 | $341,511 |
| 2023 | $14,337 | $644,300 | $302,789 | $341,511 |
| 2022 | $14,540 | $580,979 | $129,767 | $451,212 |
| 2021 | $15,158 | $580,979 | $129,767 | $451,212 |
| 2020 | $16,099 | $580,979 | $129,767 | $451,212 |
| 2019 | $17,167 | $580,979 | $129,767 | $451,212 |
| 2018 | $17,174 | $580,979 | $129,767 | $451,212 |
| 2017 | $17,992 | $611,198 | $129,767 | $481,431 |
| 2016 | $17,992 | $611,198 | $129,767 | $481,431 |
| 2015 | $16,292 | $611,198 | $129,767 | $481,431 |
| 2014 | $16,292 | $611,198 | $129,767 | $481,431 |
Source: Public Records
Map
Nearby Homes
- 311 N Pendell Ave
- 911 W Chambers St
- 101 S Pendell Ave
- 1016 Sheridan Ln
- 1300 Belvon Place
- 106 Glen Rose Ave
- 1006 Princeton Place
- 604 Mcanear St
- 114 S Field St
- 215 Sunset Dr
- 1102 Lena St
- 415 Featherston St
- 104 Dixon St
- 404 Forrest Ave
- 311 Sunset Dr
- 306 Prairie Ave
- 618 Woodard Ave
- 1108 Trace Rd
- 204 S Walnut St
- 1103 Trace Rd