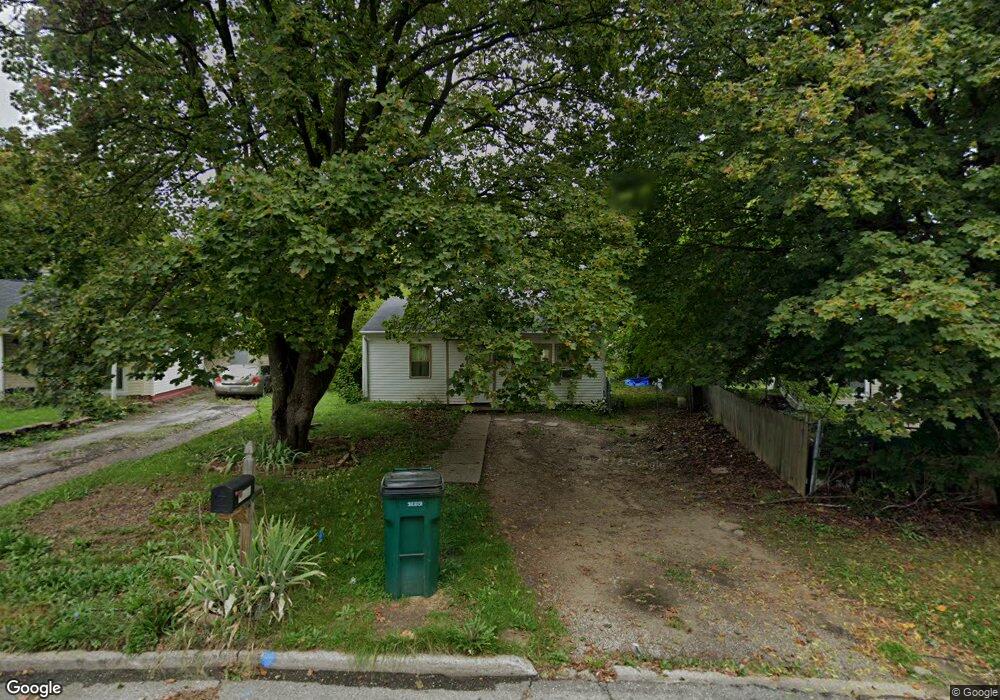
1206 Warwick Dr Lansing, MI 48910
Pleasant Grove NeighborhoodEstimated Value: $75,000 - $103,000
2
Beds
1
Bath
707
Sq Ft
$125/Sq Ft
Est. Value
About This Home
This home is located at 1206 Warwick Dr, Lansing, MI 48910 and is currently estimated at $88,536, approximately $125 per square foot. 1206 Warwick Dr is a home located in Ingham County with nearby schools including Reo Elementary School, Attwood School, and Everett High School.
Ownership History
Date
Name
Owned For
Owner Type
Purchase Details
Closed on
Apr 23, 2009
Sold by
Preston Mark D
Bought by
Federal Home Loan Mortgage Corp
Current Estimated Value
Purchase Details
Closed on
May 23, 2005
Sold by
Us Bank Na
Bought by
Preston Mark
Home Financials for this Owner
Home Financials are based on the most recent Mortgage that was taken out on this home.
Original Mortgage
$36,100
Interest Rate
5.87%
Mortgage Type
Fannie Mae Freddie Mac
Purchase Details
Closed on
Mar 25, 2004
Sold by
Mccomb Douglas
Bought by
U S Bank Na and Csfb Abs Trust Series 2001-He12
Purchase Details
Closed on
Sep 2, 2000
Sold by
Pavlica Paul J
Bought by
Mccomb Douglas
Home Financials for this Owner
Home Financials are based on the most recent Mortgage that was taken out on this home.
Original Mortgage
$43,350
Interest Rate
12.25%
Mortgage Type
Purchase Money Mortgage
Create a Home Valuation Report for This Property
The Home Valuation Report is an in-depth analysis detailing your home's value as well as a comparison with similar homes in the area
Home Values in the Area
Average Home Value in this Area
Purchase History
| Date | Buyer | Sale Price | Title Company |
|---|---|---|---|
| Federal Home Loan Mortgage Corp | $60,908 | None Available | |
| Preston Mark | $38,000 | Fatic | |
| U S Bank Na | $53,161 | -- | |
| Mccomb Douglas | $47,000 | -- |
Source: Public Records
Mortgage History
| Date | Status | Borrower | Loan Amount |
|---|---|---|---|
| Previous Owner | Preston Mark | $36,100 | |
| Previous Owner | Mccomb Douglas | $43,350 |
Source: Public Records
Tax History
| Year | Tax Paid | Tax Assessment Tax Assessment Total Assessment is a certain percentage of the fair market value that is determined by local assessors to be the total taxable value of land and additions on the property. | Land | Improvement |
|---|---|---|---|---|
| 2025 | $1,896 | $33,800 | $6,300 | $27,500 |
| 2024 | $15 | $29,500 | $6,300 | $23,200 |
| 2023 | $1,786 | $26,200 | $6,300 | $19,900 |
| 2022 | $1,634 | $24,600 | $6,300 | $18,300 |
| 2021 | $1,939 | $22,300 | $4,700 | $17,600 |
| 2020 | $1,585 | $21,200 | $4,700 | $16,500 |
| 2019 | $1,529 | $21,000 | $4,700 | $16,300 |
| 2018 | $1,452 | $18,400 | $4,700 | $13,700 |
| 2017 | $1,396 | $18,400 | $4,700 | $13,700 |
| 2016 | $1,404 | $18,100 | $4,700 | $13,400 |
| 2015 | $1,404 | $17,600 | $9,309 | $8,291 |
| 2014 | $1,404 | $18,200 | $12,218 | $5,982 |
Source: Public Records
Map
Nearby Homes
- 1113 Eaton Ct
- 1319 Hillcrest St
- 0 Eaton Ct
- 1422 Warwick Dr
- VL Hillcrest St
- 3815 Walton Dr
- 0 Burchfield Dr
- 3705 Burchfield Dr
- 1715 Hillcrest St
- 3429 Lowcroft Ave
- 4414 S Martin Luther King jr Blvd
- 1429 Pierce Rd
- 4125 Lowcroft Ave
- 1904 Hillcrest St
- 823 Loa St
- 3723 Weger Place
- 1420 Reo Rd
- 924 Loa St
- 600 W Cavanaugh Rd
- 511 W Berry Ave
- 1210 Warwick Dr
- 1124 Warwick Dr
- 1212 Warwick Dr
- 1215 Warwick Dr
- 1216 Warwick Dr
- 1125 Warwick Dr
- 3612 S Martin Luther King Junior Blvd
- 1222 Warwick Dr
- 1204 Pompton Cir
- 1223 Warwick Dr
- 1209 Pompton Cir
- 1228 Warwick Dr
- 0 S Martin Luther King Junior Blvd
- 1227 Warwick Dr
- 1208 Pompton Cir
- 1213 Pompton Cir
- 1231 Warwick Dr
- 1232 Warwick Dr
- 1216 Pompton Cir
- 1228 Pompton Cir
Your Personal Tour Guide
Ask me questions while you tour the home.