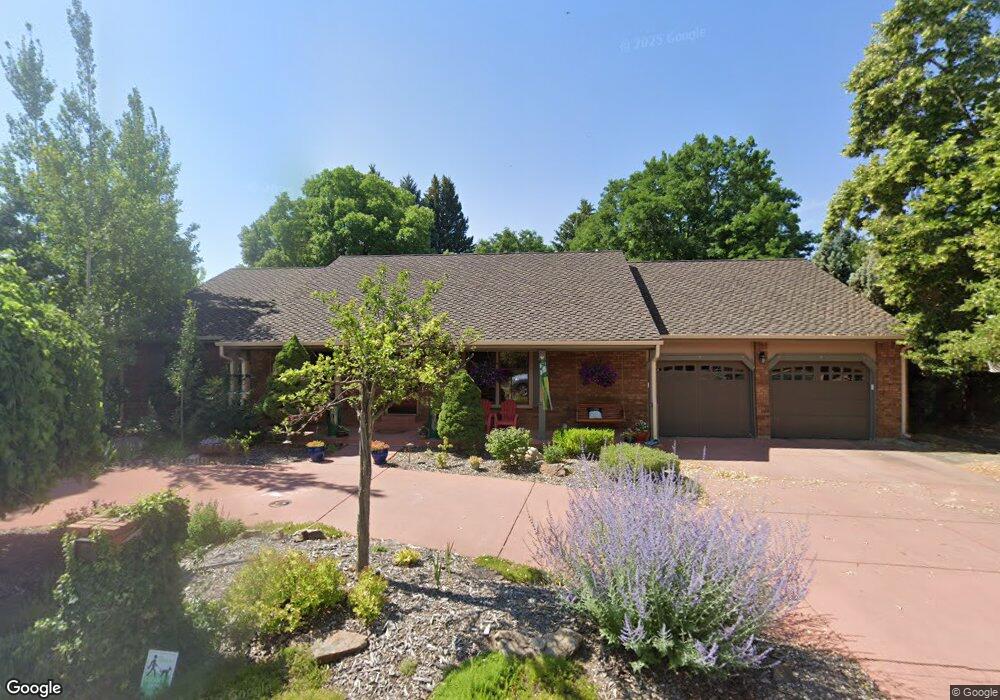
12060 W 54th Ave Arvada, CO 80002
Rainbow Ridge NeighborhoodEstimated Value: $910,000 - $987,000
4
Beds
3
Baths
3,564
Sq Ft
$264/Sq Ft
Est. Value
About This Home
This home is located at 12060 W 54th Ave, Arvada, CO 80002 and is currently estimated at $941,634, approximately $264 per square foot. 12060 W 54th Ave is a home located in Jefferson County with nearby schools including Vanderhoof Elementary School, Drake Junior High School, and Arvada West High School.
Ownership History
Date
Name
Owned For
Owner Type
Purchase Details
Closed on
Oct 14, 2016
Sold by
Skavish Peter L and Skavish Natalia
Bought by
Patterson Nicholas G and Patterson Katie A
Current Estimated Value
Home Financials for this Owner
Home Financials are based on the most recent Mortgage that was taken out on this home.
Original Mortgage
$448,000
Outstanding Balance
$358,928
Interest Rate
3.44%
Mortgage Type
New Conventional
Estimated Equity
$582,706
Purchase Details
Closed on
Oct 29, 2012
Sold by
Wirth Thereasa M
Bought by
Skavish Peter L and Skavish Natalia
Home Financials for this Owner
Home Financials are based on the most recent Mortgage that was taken out on this home.
Original Mortgage
$332,000
Interest Rate
3.52%
Mortgage Type
New Conventional
Create a Home Valuation Report for This Property
The Home Valuation Report is an in-depth analysis detailing your home's value as well as a comparison with similar homes in the area
Home Values in the Area
Average Home Value in this Area
Purchase History
| Date | Buyer | Sale Price | Title Company |
|---|---|---|---|
| Patterson Nicholas G | $560,000 | None Available | |
| Skavish Peter L | $415,000 | Land Title Guarantee Company |
Source: Public Records
Mortgage History
| Date | Status | Borrower | Loan Amount |
|---|---|---|---|
| Open | Patterson Nicholas G | $448,000 | |
| Previous Owner | Skavish Peter L | $332,000 |
Source: Public Records
Tax History
| Year | Tax Paid | Tax Assessment Tax Assessment Total Assessment is a certain percentage of the fair market value that is determined by local assessors to be the total taxable value of land and additions on the property. | Land | Improvement |
|---|---|---|---|---|
| 2024 | $5,522 | $58,537 | $24,572 | $33,965 |
| 2023 | $5,522 | $58,537 | $24,572 | $33,965 |
| 2022 | $4,544 | $47,711 | $17,447 | $30,264 |
| 2021 | $4,617 | $49,084 | $17,949 | $31,135 |
| 2020 | $4,154 | $44,217 | $14,359 | $29,858 |
| 2019 | $4,098 | $44,217 | $14,359 | $29,858 |
| 2018 | $3,969 | $41,654 | $10,716 | $30,938 |
| 2017 | $3,627 | $41,654 | $10,716 | $30,938 |
| 2016 | $3,574 | $38,469 | $10,943 | $27,526 |
| 2015 | $2,575 | $38,469 | $10,943 | $27,526 |
| 2014 | $2,575 | $26,093 | $9,353 | $16,740 |
Source: Public Records
Map
Nearby Homes
- 11890 W 52nd Ave
- 11463 W 53rd Place
- 5358 Routt St Unit B
- 5378 Routt St Unit B
- 5240 Routt Ct Unit B
- 12336 W 52nd Ave
- 5181 Vivian St
- 5218 Routt St Unit A
- 5192 Rob Way
- 5182 Rob Way
- 12340 W 51st Ave
- 5188 Rob Way
- 5555 Ward Rd
- 12323 Ridge Rd
- 11232 W 53rd Dr
- 5327 Quail Way
- 5134 Queen Ct
- 5383 Quail St
- 12270 W 57th Ave
- 5365 Quail St
- 12050 W 54th Ave
- 12070 W 54th Ave
- 12065 W 53rd Place
- 12055 W 53rd Place
- 12061 W 54th Ave
- 12075 W 53rd Place
- 12080 W 54th Ave
- 12035 W 53rd Place
- 12051 W 54th Ave
- 12071 W 54th Ave
- 12045 W 53rd Place
- 12085 W 53rd Place
- 12041 W 54th Ave
- 5390 Union Way
- 12064 W 54th Dr
- 12054 W 54th Dr
- 12074 W 53rd Place
- 12074 W 54th Dr
- 12054 W 53rd Place
- 12031 W 54th Ave
Your Personal Tour Guide
Ask me questions while you tour the home.