
Seller's Agent in 2012
Lynwood Richards
South Point Realty of Atlanta
(404) 391-7600
4 Total Sales
Estimated Value: $267,000 - $277,000
Please note, our homes are available on a first-come, first-serve basis and are not reserved until the lease is signed by all applicants and security deposits are collected.
This home features Progress Smart Home - Progress Residential's smart home app, which allows you to control the home securely from any of your devices. Learn more at
Want to tour on your own? Click the “Self Tour” button on this home’s listing or call to register for a self-guided showing at a time that works best for you.
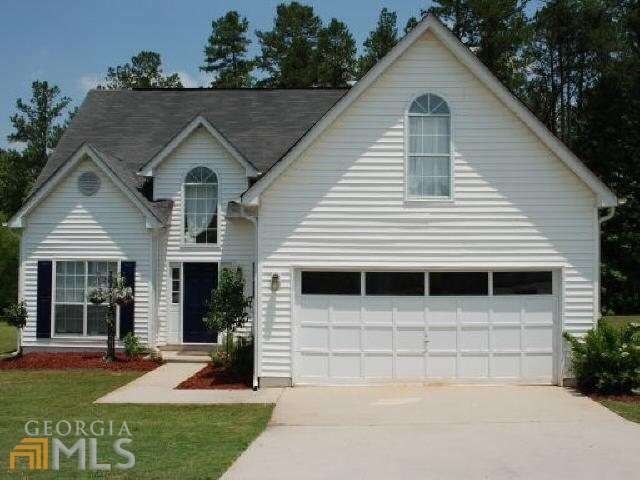
Check out this Fayetteville rental home with four bedrooms and two-and-one-half bathrooms. The living room's soaring ceiling with a fan confers a comfortable breeze on warm summer days. When the weather cools, build a fire in the living room's fireplace. In the kitchen, stainless steel appliances make it easy to cook a large meal. Place your dining room table under the light from the modern chandelier, or dine on the backyard's patio. Rest well thanks to the first-floor main bedroom's tray-style ceiling with a fan. Begin a new day in the walk-in shower of the private bathroom. Take a relaxing soak in the evening in the bathroom's garden tub. Schedule an in-person tour of this rental home today.
Last Agent to Rent the Property
Patty Middleton
PMI Georgia License #309143 Listed on: 05/31/2012
| Date | Buyer | Sale Price | Title Company |
|---|---|---|---|
| Yamasa Co Ltd | $190,000 | -- | |
| Smsf Rowe Llc | $50,000 | -- | |
| Trr Atl Property Llc | $50,000 | -- | |
| Federal National Mtg Associati | $114,723 | -- | |
| Flagstar Bank Fsb | $114,723 | -- | |
| Sinclair Travis | $123,500 | -- | |
| 12063 Harbourtown Pkwy Holt Trus | -- | -- | |
| Cooke Charles T | $116,200 | -- |
| Date | Status | Borrower | Loan Amount |
|---|---|---|---|
| Previous Owner | Sinclair Travis | $117,300 | |
| Closed | Cooke Charles T | $0 |
| Date | Event | Price | Change | Sq Ft Price |
|---|---|---|---|---|
| 04/29/2025 04/29/25 | Off Market | $2,200 | -- | -- |
| 04/16/2025 04/16/25 | Price Changed | $2,200 | +1.9% | $1 / Sq Ft |
| 04/15/2025 04/15/25 | Price Changed | $2,160 | -0.2% | $1 / Sq Ft |
| 04/12/2025 04/12/25 | Price Changed | $2,165 | -0.2% | $1 / Sq Ft |
| 04/11/2025 04/11/25 | Price Changed | $2,170 | +0.9% | $1 / Sq Ft |
| 04/09/2025 04/09/25 | Price Changed | $2,150 | -0.9% | $1 / Sq Ft |
| 04/04/2025 04/04/25 | Price Changed | $2,170 | +1.9% | $1 / Sq Ft |
| 04/03/2025 04/03/25 | Price Changed | $2,130 | +0.2% | $1 / Sq Ft |
| 04/01/2025 04/01/25 | Price Changed | $2,125 | +0.2% | $1 / Sq Ft |
| 03/31/2025 03/31/25 | Price Changed | $2,120 | +0.2% | $1 / Sq Ft |
| 03/30/2025 03/30/25 | Price Changed | $2,115 | +0.2% | $1 / Sq Ft |
| 03/28/2025 03/28/25 | Price Changed | $2,110 | -1.9% | $1 / Sq Ft |
| 03/28/2025 03/28/25 | Price Changed | $2,150 | +0.2% | $1 / Sq Ft |
| 03/24/2025 03/24/25 | Price Changed | $2,145 | +0.2% | $1 / Sq Ft |
| 03/23/2025 03/23/25 | Price Changed | $2,140 | +0.2% | $1 / Sq Ft |
| 03/20/2025 03/20/25 | Price Changed | $2,135 | +0.2% | $1 / Sq Ft |
| 03/18/2025 03/18/25 | Price Changed | $2,130 | +0.2% | $1 / Sq Ft |
| 03/11/2025 03/11/25 | Price Changed | $2,125 | +1.0% | $1 / Sq Ft |
| 03/08/2025 03/08/25 | Price Changed | $2,105 | +1.9% | $1 / Sq Ft |
| 03/06/2025 03/06/25 | Price Changed | $2,065 | -28.5% | $1 / Sq Ft |
| 03/05/2025 03/05/25 | Price Changed | $2,890 | +40.0% | $2 / Sq Ft |
| 03/04/2025 03/04/25 | For Rent | $2,065 | +88.6% | -- |
| 05/31/2012 05/31/12 | For Rent | $1,095 | +6.8% | -- |
| 05/31/2012 05/31/12 | Rented | $1,025 | 0.0% | -- |
| 04/05/2012 04/05/12 | Sold | $50,000 | 0.0% | $28 / Sq Ft |
| 03/06/2012 03/06/12 | Pending | -- | -- | -- |
| 01/28/2012 01/28/12 | For Sale | $50,000 | -- | $28 / Sq Ft |
| Year | Tax Paid | Tax Assessment Tax Assessment Total Assessment is a certain percentage of the fair market value that is determined by local assessors to be the total taxable value of land and additions on the property. | Land | Improvement |
|---|---|---|---|---|
| 2024 | $3,949 | $100,240 | $8,800 | $91,440 |
| 2023 | $3,293 | $90,160 | $8,800 | $81,360 |
| 2022 | $2,763 | $69,440 | $8,800 | $60,640 |
| 2021 | $2,311 | $57,560 | $8,800 | $48,760 |
| 2020 | $2,228 | $54,762 | $8,800 | $45,962 |
| 2019 | $2,163 | $52,344 | $9,600 | $42,744 |
| 2018 | $1,994 | $48,177 | $9,600 | $38,577 |
| 2017 | $1,729 | $41,566 | $9,600 | $31,966 |
| 2016 | $1,522 | $36,464 | $9,600 | $26,864 |
| 2015 | $1,531 | $0 | $0 | $0 |
| 2014 | $1,456 | $35,659 | $9,600 | $26,059 |
Seller's Agent in 2012
Lynwood Richards
South Point Realty of Atlanta
(404) 391-7600
4 Total Sales
P
Landlord's Agent in 2012
Patty Middleton
PMI Georgia
S
Buyer's Agent in 2012
Samantha Sharp
Compass
Source: Georgia MLS
MLS Number: 03238167
APN: 05-0085B-00A-012
Disclaimer: Certain information contained herein is derived from information provided by parties other than Homes.com. All information provided is deemed reliable, but is not guaranteed to be accurate and should be independently verified.
![]() The data relating to real estate for sale on this web site comes in part from the Broker Reciprocity Program of Georgia MLS. Real estate listings held by brokerage firms other than Redfin are marked with the Broker Reciprocity logo and detailed information about them includes the name of the listing brokers. Information deemed reliable but not guaranteed. Copyright 2025 Georgia MLS. All rights reserved.
The data relating to real estate for sale on this web site comes in part from the Broker Reciprocity Program of Georgia MLS. Real estate listings held by brokerage firms other than Redfin are marked with the Broker Reciprocity logo and detailed information about them includes the name of the listing brokers. Information deemed reliable but not guaranteed. Copyright 2025 Georgia MLS. All rights reserved.