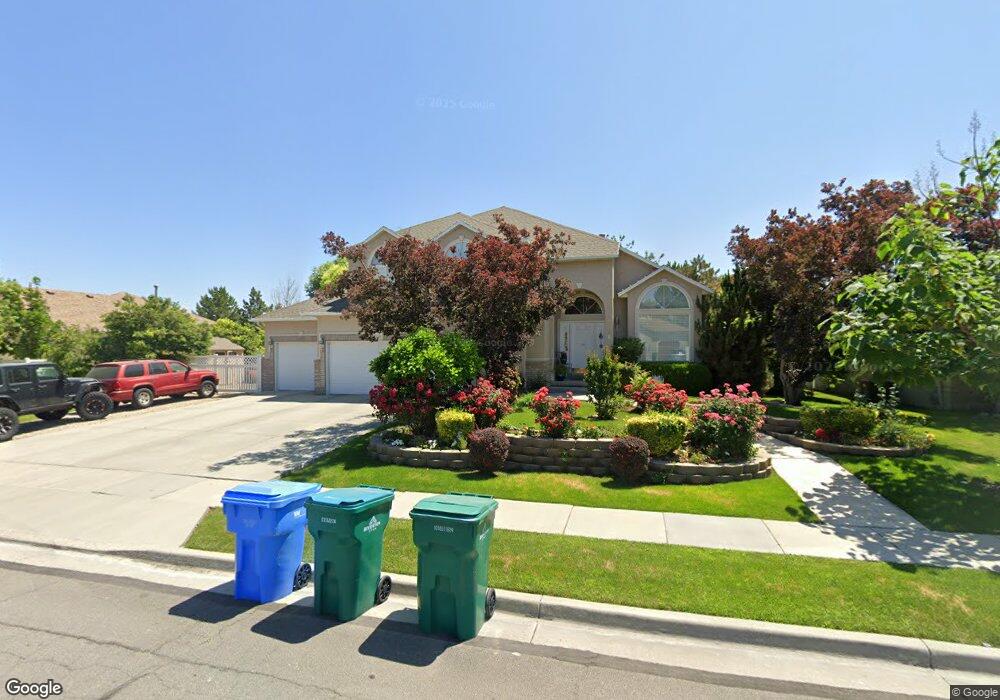
12063 S Field Downs Dr Riverton, UT 84065
Estimated Value: $707,283 - $804,000
3
Beds
3
Baths
2,108
Sq Ft
$357/Sq Ft
Est. Value
About This Home
This home is located at 12063 S Field Downs Dr, Riverton, UT 84065 and is currently estimated at $751,571, approximately $356 per square foot. 12063 S Field Downs Dr is a home located in Salt Lake County with nearby schools including Rosamond Elementary School, Oquirrh Hills Middle School, and Riverton High School.
Ownership History
Date
Name
Owned For
Owner Type
Purchase Details
Closed on
Nov 21, 2014
Sold by
Kindt Michael F
Bought by
Kindt Michael F and Kindt Robin H
Current Estimated Value
Purchase Details
Closed on
Oct 17, 2013
Sold by
Nielsen Bryan S and Nielsen Chanleang S
Bought by
Kindt Michael F
Home Financials for this Owner
Home Financials are based on the most recent Mortgage that was taken out on this home.
Original Mortgage
$343,540
Outstanding Balance
$255,616
Interest Rate
4.25%
Mortgage Type
FHA
Estimated Equity
$495,955
Purchase Details
Closed on
Jun 12, 1998
Sold by
Kehl Homes Inc
Bought by
Nielsen Bryan S and Nielsen Chanleang S
Home Financials for this Owner
Home Financials are based on the most recent Mortgage that was taken out on this home.
Original Mortgage
$110,000
Interest Rate
7.17%
Create a Home Valuation Report for This Property
The Home Valuation Report is an in-depth analysis detailing your home's value as well as a comparison with similar homes in the area
Home Values in the Area
Average Home Value in this Area
Purchase History
| Date | Buyer | Sale Price | Title Company |
|---|---|---|---|
| Kindt Michael F | -- | Accommodation | |
| Kindt Michael F | -- | United Title Services | |
| Nielsen Bryan S | -- | -- |
Source: Public Records
Mortgage History
| Date | Status | Borrower | Loan Amount |
|---|---|---|---|
| Open | Kindt Michael F | $343,540 | |
| Previous Owner | Nielsen Bryan S | $110,000 |
Source: Public Records
Tax History
| Year | Tax Paid | Tax Assessment Tax Assessment Total Assessment is a certain percentage of the fair market value that is determined by local assessors to be the total taxable value of land and additions on the property. | Land | Improvement |
|---|---|---|---|---|
| 2025 | $3,785 | $668,500 | $287,700 | $380,800 |
| 2024 | $3,785 | $655,100 | $261,100 | $394,000 |
| 2023 | $3,984 | $650,000 | $258,500 | $391,500 |
| 2022 | $3,937 | $630,100 | $253,500 | $376,600 |
| 2021 | $3,340 | $476,000 | $164,400 | $311,600 |
| 2020 | $3,247 | $431,400 | $164,400 | $267,000 |
| 2019 | $3,229 | $421,800 | $164,400 | $257,400 |
| 2016 | $2,867 | $344,800 | $153,400 | $191,400 |
Source: Public Records
Map
Nearby Homes
- 2329 W Myers Ln
- 11788 S Myers Park Ln Unit 101
- 2127 Silver Tree Cir
- 2511 W 11730 S
- 12332 S 2700 W
- 2853 W 12075 S
- 11718 S Myers Park Ln Unit 105
- 11716 S 2610 W
- 11710 S Myers Park Ln Unit 106
- 12501 Falls Creek Rd
- 2356 W Montcalm Dr
- 2602 W 11625 S
- 11666 S Gold Dust Dr
- 3042 W Chalk Creek Way
- 2872 W Rolling Creek Way
- 1719 W 12050 S
- 3124 W Elmwood Dr
- 1721 W Hollow Cedar Ln Unit 1
- 3116 Current Creek Dr
- 3168 Chalk Creek Way
- 12081 Field Downs Dr
- 2479 W 12040 S
- 12086 S 2495 W
- 12072 Field Downs Dr
- 12099 Field Downs Dr
- 12099 S Field Downs Dr
- 12052 Field Downs Dr
- 12086 Field Downs Dr
- 2466 W 12040 S
- 2474 W 12040 S
- 12117 Field Downs Dr
- 12104 Field Downs Dr
- 2494 W 12040 S
- 2370 Eva Lynn Cir
- 2512 W 12040 S
- 12127 Field Downs Dr
- 12071 Shannel Cir
- 12059 Shannel Cir
- 2532 W 12040 S
- 12087 S Shannel Cir
Your Personal Tour Guide
Ask me questions while you tour the home.