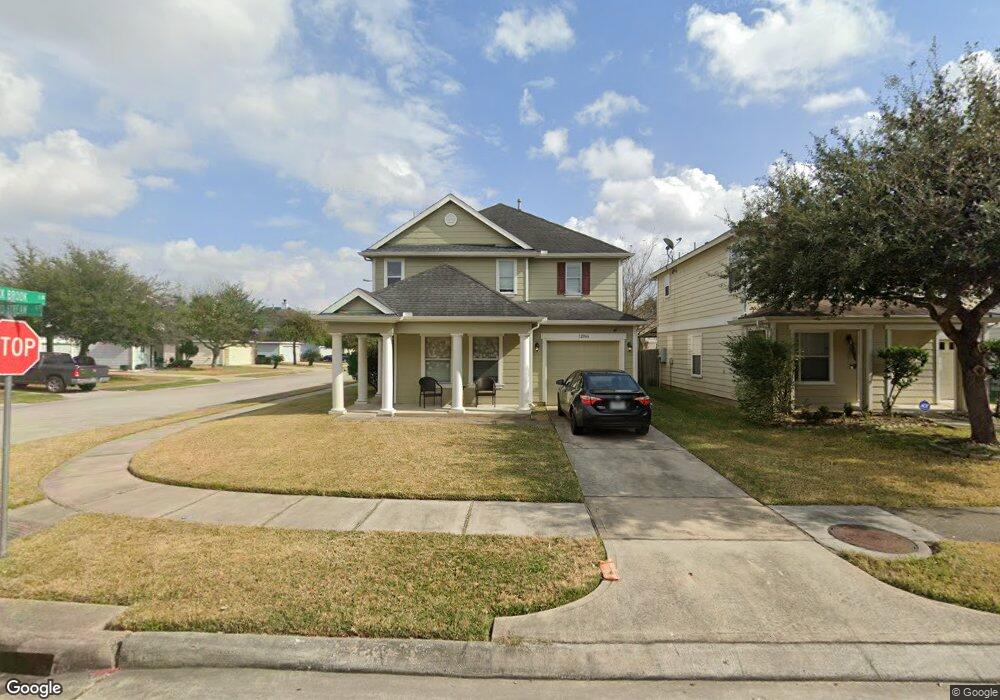
12066 Mallard Stream St Houston, TX 77038
North Houston NeighborhoodEstimated Value: $246,943 - $266,000
4
Beds
3
Baths
2,207
Sq Ft
$116/Sq Ft
Est. Value
About This Home
This home is located at 12066 Mallard Stream St, Houston, TX 77038 and is currently estimated at $256,736, approximately $116 per square foot. 12066 Mallard Stream St is a home located in Harris County with nearby schools including Kujawa EC/Pre-K/K School, Carter Academy, and Shotwell Middle School.
Ownership History
Date
Name
Owned For
Owner Type
Purchase Details
Closed on
Aug 6, 2013
Sold by
The Secretary Of Hud Of Washington Dc
Bought by
Rodrigues Jose and Rodrigues Ivelisse
Current Estimated Value
Home Financials for this Owner
Home Financials are based on the most recent Mortgage that was taken out on this home.
Original Mortgage
$68,732
Outstanding Balance
$49,780
Interest Rate
3.75%
Mortgage Type
FHA
Estimated Equity
$206,956
Purchase Details
Closed on
Jul 18, 2012
Sold by
Bank Of America Na
Bought by
Secretary Of Hud Of Washington Dc
Purchase Details
Closed on
Apr 3, 2012
Sold by
Hunter Michael and Dominguez Andrea
Bought by
Bank Of America Na
Purchase Details
Closed on
Nov 29, 2007
Sold by
Kb Home Lone Star Inc
Bought by
Hunter Michael and Dominguez Andrea
Home Financials for this Owner
Home Financials are based on the most recent Mortgage that was taken out on this home.
Original Mortgage
$122,189
Interest Rate
6.4%
Mortgage Type
FHA
Create a Home Valuation Report for This Property
The Home Valuation Report is an in-depth analysis detailing your home's value as well as a comparison with similar homes in the area
Home Values in the Area
Average Home Value in this Area
Purchase History
| Date | Buyer | Sale Price | Title Company |
|---|---|---|---|
| Rodrigues Jose | -- | None Available | |
| Secretary Of Hud Of Washington Dc | -- | None Available | |
| Bank Of America Na | $144,503 | None Available | |
| Hunter Michael | -- | First American Title |
Source: Public Records
Mortgage History
| Date | Status | Borrower | Loan Amount |
|---|---|---|---|
| Open | Rodrigues Jose | $68,732 | |
| Previous Owner | Hunter Michael | $122,189 |
Source: Public Records
Tax History Compared to Growth
Tax History
| Year | Tax Paid | Tax Assessment Tax Assessment Total Assessment is a certain percentage of the fair market value that is determined by local assessors to be the total taxable value of land and additions on the property. | Land | Improvement |
|---|---|---|---|---|
| 2025 | $5,924 | $265,249 | $44,072 | $221,177 |
| 2024 | $5,924 | $265,249 | $44,072 | $221,177 |
| 2023 | $5,924 | $266,346 | $44,072 | $222,274 |
| 2022 | $6,574 | $235,941 | $26,710 | $209,231 |
| 2021 | $6,209 | $199,676 | $26,710 | $172,966 |
| 2020 | $5,834 | $174,633 | $26,710 | $147,923 |
| 2019 | $5,463 | $154,698 | $20,033 | $134,665 |
| 2018 | $1,579 | $135,000 | $20,033 | $114,967 |
| 2017 | $4,815 | $135,000 | $20,033 | $114,967 |
| 2016 | $4,920 | $137,944 | $20,033 | $117,911 |
| 2015 | $3,841 | $120,808 | $20,033 | $100,775 |
| 2014 | $3,841 | $108,815 | $20,033 | $88,782 |
Source: Public Records
Map
Nearby Homes
- 12042 Mallard Stream Ct
- 12026 Madison Oak St
- 12015 Audubon Hill Ct
- 12006 Mallard Stream Ct
- 12007 Bach Orchard Trail
- 2934 Valiant Scene Ct
- 2907 Valiant Scene Ct
- 2702 Urban Glen Ct
- 2743 Oriole Wood Ct
- 2746 Piney Lake Ct
- 11707 Madison Oak St
- 12518 Pelican Bay Dr
- 2610 Cabin Cove Ln
- 11726 Wren Crossing Dr
- 2606 Oakwood Bluff Trail
- Whitetail Plan at Forestwood
- Kitson Plan at Forestwood
- Pinehollow Plan at Forestwood
- 12530 Wild Strawberry Rd
- Idlewood Plan at Forestwood
- 12062 Mallard Stream St
- 12058 Mallard Stream St
- 12067 Audubon Hill Ct
- 12063 Audubon Hill Ct
- 12054 Mallard Stream Ct
- 12054 Mallard Stream St
- 2906 Paddock Brook Ln
- 2910 Paddock Brook Ln
- 12059 Audubon Hill Ct
- 2902 Paddock Brook Ln
- 2914 Paddock Brook Ln
- 12050 Mallard Stream Ct
- 12063 Mallard Stream Ct
- 12050 Mallard Stream St
- 2878 Paddock Brook Ln
- 12055 Audubon Hill Ct
- 2918 Paddock Brook Ln
- 2922 Paddock Brook Ln
- 12067 Mallard Stream St
- 12063 Mallard Stream St