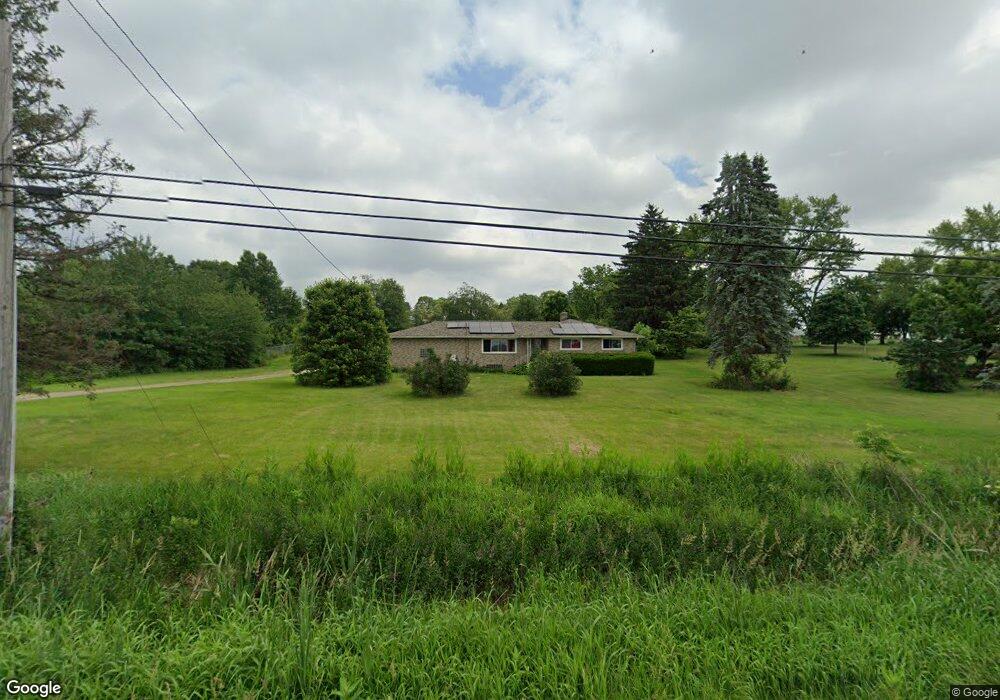
12069 Benner Rd Rittman, OH 44270
Estimated Value: $198,000 - $266,610
3
Beds
2
Baths
1,399
Sq Ft
$168/Sq Ft
Est. Value
About This Home
This home is located at 12069 Benner Rd, Rittman, OH 44270 and is currently estimated at $235,653, approximately $168 per square foot. 12069 Benner Rd is a home located in Wayne County with nearby schools including Rittman Elementary School, Rittman Middle School, and Rittman High School.
Ownership History
Date
Name
Owned For
Owner Type
Purchase Details
Closed on
May 26, 2022
Sold by
Snell Derik W
Bought by
Harty Kerry I
Current Estimated Value
Purchase Details
Closed on
Dec 1, 2006
Sold by
Young James R and Young Jason A
Bought by
Kupfner Kerry I and Snell Derik W
Home Financials for this Owner
Home Financials are based on the most recent Mortgage that was taken out on this home.
Original Mortgage
$112,500
Interest Rate
6.4%
Mortgage Type
New Conventional
Purchase Details
Closed on
Oct 2, 2006
Sold by
Young James R and Young Doris E
Bought by
Young Jason A and Young Kenneth J
Home Financials for this Owner
Home Financials are based on the most recent Mortgage that was taken out on this home.
Original Mortgage
$112,500
Interest Rate
6.4%
Mortgage Type
New Conventional
Purchase Details
Closed on
Jan 1, 1987
Bought by
Young James R and Young Jason A
Create a Home Valuation Report for This Property
The Home Valuation Report is an in-depth analysis detailing your home's value as well as a comparison with similar homes in the area
Home Values in the Area
Average Home Value in this Area
Purchase History
| Date | Buyer | Sale Price | Title Company |
|---|---|---|---|
| Harty Kerry I | -- | None Listed On Document | |
| Kupfner Kerry I | $125,000 | Attorney | |
| Young Jason A | -- | Attorney | |
| Young James R | -- | Attorney | |
| Young James R | -- | -- |
Source: Public Records
Mortgage History
| Date | Status | Borrower | Loan Amount |
|---|---|---|---|
| Previous Owner | Kupfner Kerry I | $112,500 |
Source: Public Records
Tax History Compared to Growth
Tax History
| Year | Tax Paid | Tax Assessment Tax Assessment Total Assessment is a certain percentage of the fair market value that is determined by local assessors to be the total taxable value of land and additions on the property. | Land | Improvement |
|---|---|---|---|---|
| 2024 | $2,820 | $65,210 | $18,970 | $46,240 |
| 2023 | $2,820 | $65,210 | $18,970 | $46,240 |
| 2022 | $2,314 | $48,300 | $14,050 | $34,250 |
| 2021 | $2,342 | $48,300 | $14,050 | $34,250 |
| 2020 | $2,386 | $48,300 | $14,050 | $34,250 |
| 2019 | $1,977 | $37,970 | $12,160 | $25,810 |
| 2018 | $1,974 | $37,970 | $12,160 | $25,810 |
| 2017 | $1,938 | $37,970 | $12,160 | $25,810 |
| 2016 | $1,941 | $36,740 | $12,160 | $24,580 |
| 2015 | $1,914 | $36,740 | $12,160 | $24,580 |
| 2014 | $1,882 | $36,740 | $12,160 | $24,580 |
| 2013 | $1,767 | $34,340 | $10,740 | $23,600 |
Source: Public Records
Map
Nearby Homes
- 10834 Easton Rd
- 12163 Benner Rd
- 10932 Easton Rd
- 10847 Easton Rd
- 10964 Easton Rd
- V/L Easton Rd
- 11010 Easton Rd
- 12230 Benner Rd
- 11011 Easton Rd
- 12266 Benner Rd
- 11050 Easton Rd
- 12306 Benner Rd
- 11034 Easton Rd
- 11088 Easton Rd
- 11103 Easton Rd
- 11106 Easton Rd
- 11071 Easton Rd
- 11130 Easton Rd
- 11146 Easton Rd
- 12391 Benner Rd