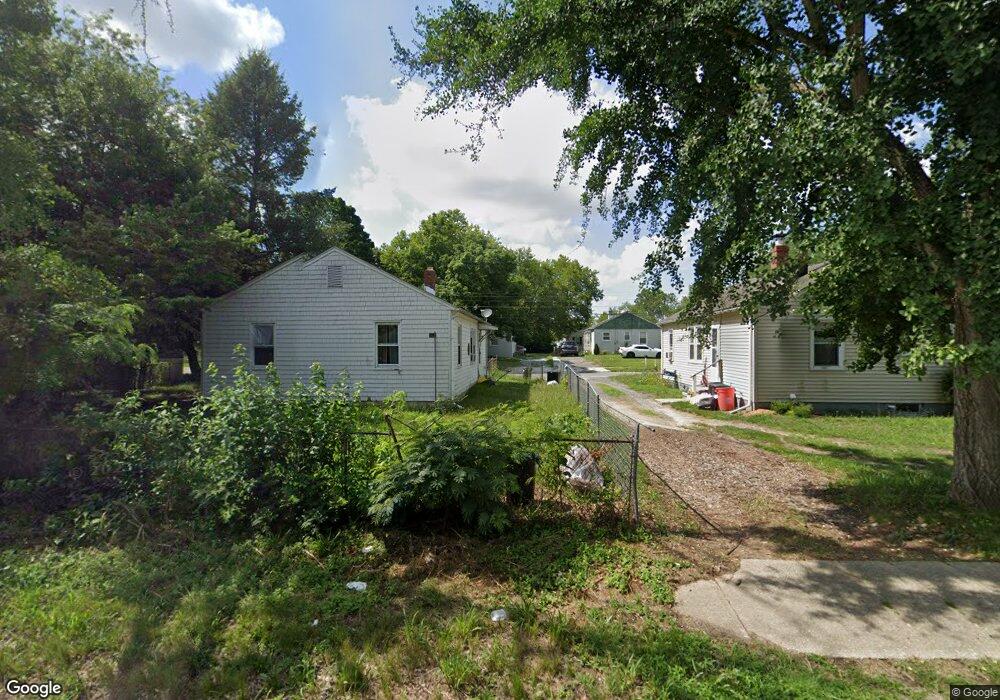
1207 1st Ave Seabrook, NJ 08302
Estimated Value: $197,000 - $233,000
3
Beds
1
Bath
864
Sq Ft
$255/Sq Ft
Est. Value
About This Home
This home is located at 1207 1st Ave, Seabrook, NJ 08302 and is currently estimated at $220,350, approximately $255 per square foot. 1207 1st Ave is a home located in Cumberland County with nearby schools including Charles F. Seabrook School, Elizabeth F. Moore School, and Woodruff Middle School.
Ownership History
Date
Name
Owned For
Owner Type
Purchase Details
Closed on
May 19, 2022
Sold by
Lxr Nj 3 Llc
Bought by
Lxr Lpp 13 Llc
Current Estimated Value
Purchase Details
Closed on
Dec 29, 2011
Sold by
Gunnison Properties Llc
Bought by
Mbm Properties Iii Llc
Purchase Details
Closed on
Jan 16, 2007
Sold by
Kerr & Associates Llc
Bought by
Gunnison Properties Llc
Purchase Details
Closed on
May 18, 2006
Sold by
Gunnison Village Inc
Bought by
Kerr & Associates Llc
Create a Home Valuation Report for This Property
The Home Valuation Report is an in-depth analysis detailing your home's value as well as a comparison with similar homes in the area
Home Values in the Area
Average Home Value in this Area
Purchase History
| Date | Buyer | Sale Price | Title Company |
|---|---|---|---|
| Lxr Lpp 13 Llc | -- | None Listed On Document | |
| Mbm Properties Iii Llc | $100,000 | -- | |
| Gunnison Properties Llc | -- | -- | |
| Kerr & Associates Llc | $414,000 | -- |
Source: Public Records
Tax History
| Year | Tax Paid | Tax Assessment Tax Assessment Total Assessment is a certain percentage of the fair market value that is determined by local assessors to be the total taxable value of land and additions on the property. | Land | Improvement |
|---|---|---|---|---|
| 2025 | $2,322 | $108,200 | $23,900 | $84,300 |
| 2024 | $2,322 | $69,400 | $23,900 | $45,500 |
Source: Public Records
Map
Nearby Homes
- 5 Eisenhower Dr
- 76 Northville Rd
- 2 Weber Rd
- 481 Harvest Ln
- 259 Finley Rd
- 22 Hilton Ave
- 166 Woodruff Rd
- 5 Holly Ave
- 71 Button Mill Rd
- 18 Centerton Rd
- 4 E Finley Rd
- 537 Centerton Rd
- 1 S Woodruff Rd
- 65 Dawson Dr
- 200 Cornwell Dr
- 64 Rosedale Dr
- 4 Weymouth Place
- 109 W Dawson Dr
- 1737 S Burlington Rd
- 83 Oakland Dr
Your Personal Tour Guide
Ask me questions while you tour the home.