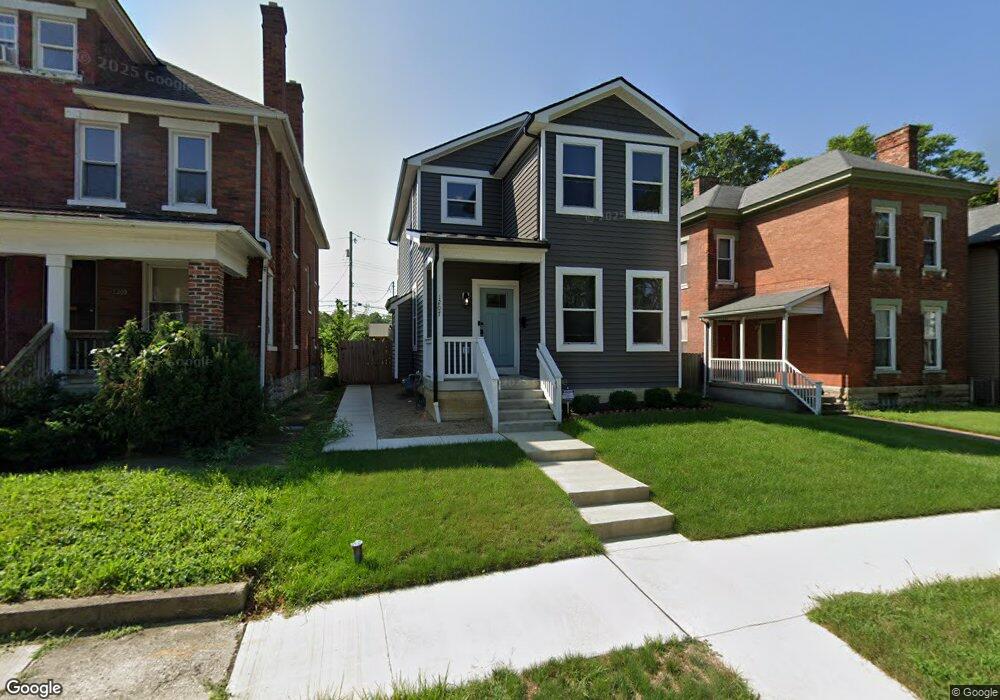
1207 E Rich St Columbus, OH 43205
Olde Towne East NeighborhoodEstimated Value: $419,307 - $678,000
4
Beds
4
Baths
2,246
Sq Ft
$232/Sq Ft
Est. Value
About This Home
This home is located at 1207 E Rich St, Columbus, OH 43205 and is currently estimated at $521,327, approximately $232 per square foot. 1207 E Rich St is a home located in Franklin County with nearby schools including Ohio Avenue Elementary School, Champion Middle School, and East High School.
Ownership History
Date
Name
Owned For
Owner Type
Purchase Details
Closed on
May 15, 2019
Sold by
Right Property Group Llc
Bought by
Hwang Lee H and Hoang Thai Oanh Thi
Current Estimated Value
Home Financials for this Owner
Home Financials are based on the most recent Mortgage that was taken out on this home.
Original Mortgage
$352,000
Interest Rate
3.5%
Mortgage Type
New Conventional
Purchase Details
Closed on
Aug 18, 2017
Sold by
Infinity Realty Group Of Ohio Llc
Bought by
Right Property Group Llc
Purchase Details
Closed on
Aug 17, 2017
Sold by
Jennings W Earl
Bought by
Infinity Realty Group Of Ohio Llc
Purchase Details
Closed on
Dec 3, 2004
Sold by
Onyx Housing Assn Inc
Bought by
Jennings W Earl
Purchase Details
Closed on
Jul 31, 2003
Sold by
Rhiel Susan L
Bought by
Onyx Housing Assn Inc
Create a Home Valuation Report for This Property
The Home Valuation Report is an in-depth analysis detailing your home's value as well as a comparison with similar homes in the area
Home Values in the Area
Average Home Value in this Area
Purchase History
| Date | Buyer | Sale Price | Title Company |
|---|---|---|---|
| Hwang Lee H | $440,000 | Pm Title Llc | |
| Right Property Group Llc | $15,000 | Golden Title Box | |
| Infinity Realty Group Of Ohio Llc | $3,900 | Goldent Title Box | |
| Jennings W Earl | $60,000 | Chicago | |
| Onyx Housing Assn Inc | $320,000 | -- |
Source: Public Records
Mortgage History
| Date | Status | Borrower | Loan Amount |
|---|---|---|---|
| Previous Owner | Hwang Lee H | $352,000 |
Source: Public Records
Tax History Compared to Growth
Tax History
| Year | Tax Paid | Tax Assessment Tax Assessment Total Assessment is a certain percentage of the fair market value that is determined by local assessors to be the total taxable value of land and additions on the property. | Land | Improvement |
|---|---|---|---|---|
| 2024 | $917 | $93,070 | $20,440 | $72,630 |
| 2023 | $906 | $93,065 | $20,440 | $72,625 |
| 2022 | $82 | $150,020 | $1,580 | $148,440 |
| 2021 | $82 | $150,020 | $1,580 | $148,440 |
| 2020 | $82 | $150,020 | $1,580 | $148,440 |
| 2019 | $81 | $124,990 | $1,300 | $123,690 |
| 2018 | $87 | $1,300 | $1,300 | $0 |
| 2017 | $342 | $1,300 | $1,300 | $0 |
| 2016 | $604 | $1,510 | $1,510 | $0 |
| 2015 | $93 | $1,510 | $1,510 | $0 |
| 2014 | $94 | $1,510 | $1,510 | $0 |
| 2013 | $48 | $1,575 | $1,575 | $0 |
Source: Public Records
Map
Nearby Homes
- 1174 E Rich St Unit 1172-1174
- 1179 E Rich St
- 374 Wilson Ave Unit 374-76
- 1217 Franklin Ave Unit 219
- 347 Kendall Place
- 322-324 S Ohio Ave
- 1179 Franklin Ave
- 1140 E Mound St
- 233 S Ohio Ave Unit 11
- 436-438 S Champion Ave
- 1029 Franklin Ave
- 1046 E Cherry St
- 838 Bryden Rd
- 1084 Bryden Rd Unit 9
- 939 E Rich St
- 1469 E Rich St
- 187 S Ohio Ave
- 1258 Oak St
- 185 S Ohio Ave
- 181 S Ohio Ave
- 1209 E Rich St Unit 211
- 1203 E Rich St
- 1193 E Rich St Unit 197
- 1219 E Rich St
- 1217 E Rich St
- 1189 E Rich St
- 365 Wilson Ave
- 1200 E Rich St
- 1210 E Rich St
- 1204 E Rich St
- 1198 E Rich St
- 1198 E Rich St Unit 2
- 1205 E Rich St
- 1212 E Rich St
- 1192 E Rich St
- 375 Wilson Ave
- 1222 E Rich St
- 1173 E Rich St Unit 175
- 1173 E Rich St Unit 75
- 1173-1175 E Rich St