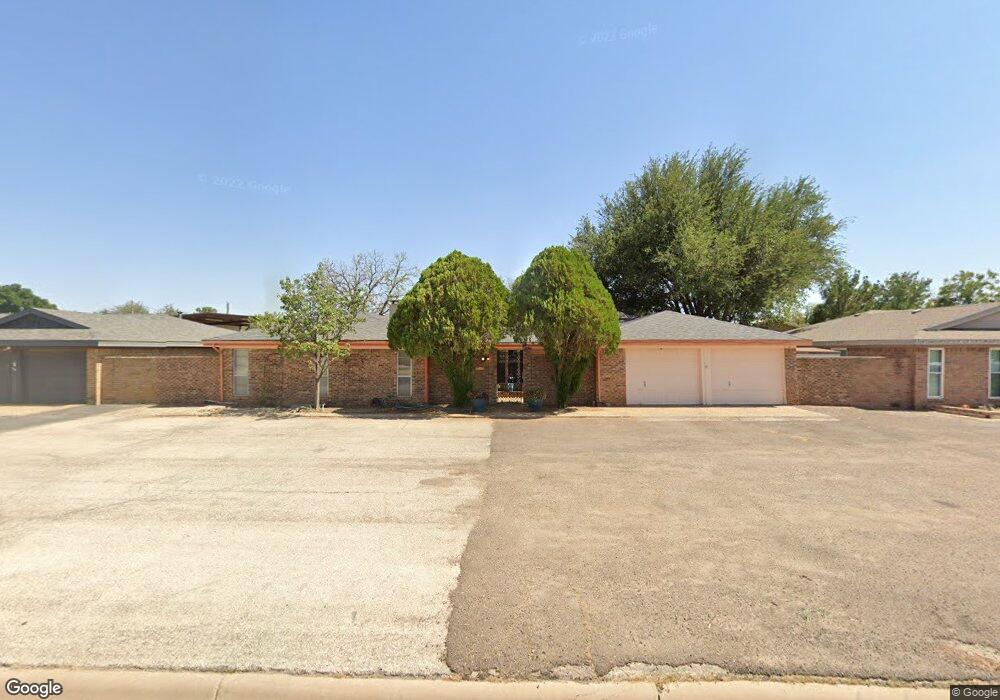
1207 Neely Ave Midland, TX 79705
Estimated Value: $370,000 - $478,000
--
Bed
2
Baths
2,337
Sq Ft
$176/Sq Ft
Est. Value
About This Home
This home is located at 1207 Neely Ave, Midland, TX 79705 and is currently estimated at $410,356, approximately $175 per square foot. 1207 Neely Ave is a home located in Midland County with nearby schools including Fannin Elementary School, Midland High School, and The Hillander School.
Ownership History
Date
Name
Owned For
Owner Type
Purchase Details
Closed on
Jan 22, 2021
Sold by
Killam Anne H and Killam Anne Hawthorne
Bought by
Moore Carl and Moore Jane
Current Estimated Value
Home Financials for this Owner
Home Financials are based on the most recent Mortgage that was taken out on this home.
Original Mortgage
$170,000
Outstanding Balance
$151,378
Interest Rate
2.71%
Mortgage Type
New Conventional
Estimated Equity
$258,978
Purchase Details
Closed on
May 27, 2016
Sold by
Killam David Thomas and Killam Anne Hawthorne
Bought by
Killam Rebecca Anne and Killam Austin David
Purchase Details
Closed on
Nov 15, 2006
Sold by
Diaz Sergio
Bought by
Killam David T and Killam Anne H
Home Financials for this Owner
Home Financials are based on the most recent Mortgage that was taken out on this home.
Original Mortgage
$121,400
Interest Rate
6.26%
Mortgage Type
Purchase Money Mortgage
Purchase Details
Closed on
Oct 15, 1979
Bought by
Killam David T
Create a Home Valuation Report for This Property
The Home Valuation Report is an in-depth analysis detailing your home's value as well as a comparison with similar homes in the area
Home Values in the Area
Average Home Value in this Area
Purchase History
| Date | Buyer | Sale Price | Title Company |
|---|---|---|---|
| Moore Carl | -- | Lone Star Abstract & Ttl Co | |
| Killam Anne H | -- | Lone Star Abstract & Ttl Co | |
| Killam Rebecca Anne | -- | None Available | |
| Killam David T | -- | None Available | |
| Killam David T | -- | -- |
Source: Public Records
Mortgage History
| Date | Status | Borrower | Loan Amount |
|---|---|---|---|
| Open | Moore Carl | $170,000 | |
| Previous Owner | Killam David T | $121,400 |
Source: Public Records
Tax History Compared to Growth
Tax History
| Year | Tax Paid | Tax Assessment Tax Assessment Total Assessment is a certain percentage of the fair market value that is determined by local assessors to be the total taxable value of land and additions on the property. | Land | Improvement |
|---|---|---|---|---|
| 2025 | $2,977 | $357,800 | $37,920 | $319,880 |
| 2024 | $2,984 | $364,570 | $37,920 | $326,650 |
| 2023 | $2,939 | $360,660 | $37,920 | $322,740 |
| 2022 | $5,276 | $337,660 | $37,920 | $299,740 |
| 2021 | $5,850 | $335,800 | $37,920 | $297,880 |
| 2020 | $5,235 | $306,760 | $37,920 | $268,840 |
| 2019 | $5,199 | $274,630 | $37,920 | $268,840 |
| 2018 | $4,854 | $249,660 | $37,920 | $211,740 |
| 2017 | $4,808 | $247,270 | $37,920 | $209,350 |
| 2016 | $4,558 | $234,000 | $37,920 | $196,080 |
| 2015 | -- | $251,850 | $37,920 | $217,970 |
| 2014 | -- | $244,210 | $37,920 | $206,290 |
Source: Public Records
Map
Nearby Homes
- 2202 Western Dr
- 2105 Oaklawn Dr
- 2109 Western Dr
- 1209 W Pecan Ave
- 907 Shirley Ct
- 806 Stanolind Ave
- 1611 W Pecan Ave
- 1200 W Scharbauer Dr
- 1202 W Scharbauer Dr
- 1210 W Scharbauer Dr
- 1602 Winfield Rd
- 1805 N D St
- 2016 Gulf Prairie Ln
- 1000 Sinclair Ave
- 2704 N L St
- 1606 Shell Ave
- TBD Bonham St
- 1605 Shell Ave
- 2000 Neely Ave
- 809 Sinclair Ave
- 1205 Neely Ave
- 1209 Neely Ave
- 1211 Neely Ave
- 1203 Neely Ave
- 1206 Stanolind Ave
- 1204 Stanolind Ave
- 1208 Stanolind Ave
- 1208 Neely Ave
- 1206 Neely Ave
- 1213 Neely Ave
- 1201 Neely Ave
- 1202 Stanolind Ave
- 1204 Neely Ave
- 1210 Neely Ave
- 1210 Stanolind Ave
- 1202 Neely Ave
- 1200 Stanolind Ave
- 1215 Neely Ave
- 1209 Shirley Ln
- 1207 Shirley Ln