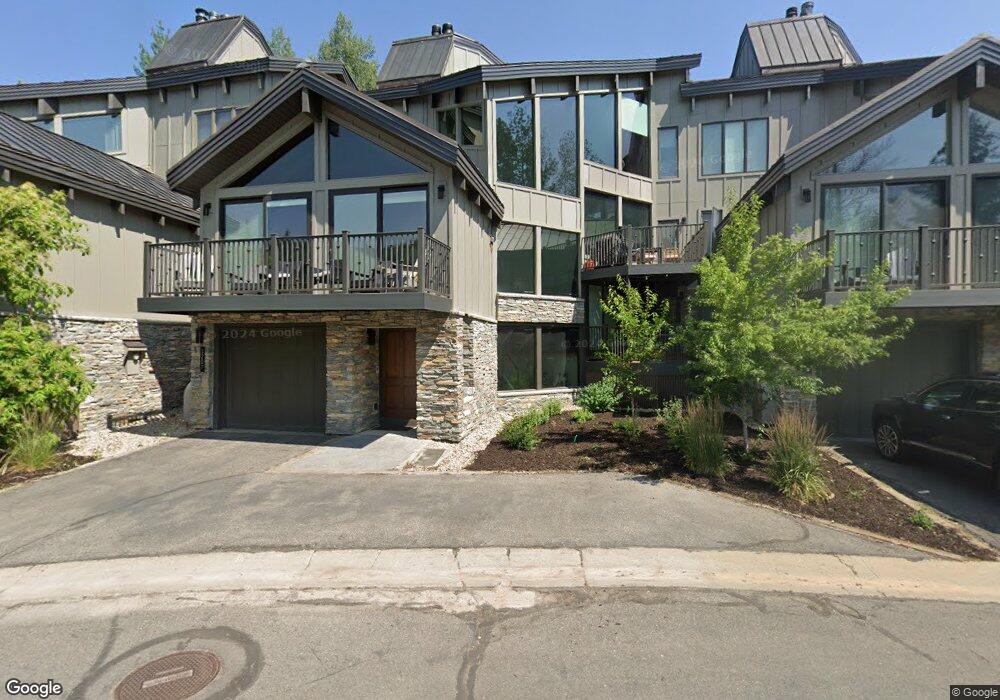
1207 Pinnacle Ct Unit 2 Park City, UT 84060
Deer Valley NeighborhoodEstimated Value: $3,075,000 - $3,654,467
4
Beds
4
Baths
3,708
Sq Ft
$908/Sq Ft
Est. Value
About This Home
This home is located at 1207 Pinnacle Ct Unit 2, Park City, UT 84060 and is currently estimated at $3,367,867, approximately $908 per square foot. 1207 Pinnacle Ct Unit 2 is a home located in Summit County with nearby schools including McPolin Elementary School, Treasure Mountain Junior High School, and Ecker Hill Middle School.
Ownership History
Date
Name
Owned For
Owner Type
Purchase Details
Closed on
Nov 6, 2024
Sold by
Pinnacle Court Llc
Bought by
Schlegel Michael
Current Estimated Value
Purchase Details
Closed on
Jul 29, 2019
Sold by
J Hagen Alan Llc
Bought by
Pinnacle Court Llc
Purchase Details
Closed on
Apr 15, 2015
Sold by
Japhet James
Bought by
J Hagen Alan Llc
Purchase Details
Closed on
Mar 13, 2015
Sold by
Lone Star Exchange Compamny
Bought by
Japhet James
Purchase Details
Closed on
Jan 11, 2007
Sold by
Japhet James H
Bought by
J Hagen Alan Llc
Purchase Details
Closed on
Sep 15, 2006
Sold by
Valdes Brayn and Valdes Patricia
Bought by
At Holding Japhet Llc
Purchase Details
Closed on
May 9, 2005
Sold by
Stuart C Johnson Family Limited Partners
Bought by
Valdes Bryan and Valdes Patricia
Create a Home Valuation Report for This Property
The Home Valuation Report is an in-depth analysis detailing your home's value as well as a comparison with similar homes in the area
Home Values in the Area
Average Home Value in this Area
Purchase History
| Date | Buyer | Sale Price | Title Company |
|---|---|---|---|
| Schlegel Michael | -- | Metro National Title | |
| Pinnacle Court Llc | -- | Real Advantage Ttl Ins Agcy | |
| J Hagen Alan Llc | -- | First American Title | |
| Japhet James | -- | Highland Title | |
| J Hagen Alan Llc | -- | -- | |
| Japhet James | -- | -- | |
| At Holding Japhet Llc | -- | None Available | |
| Valdes Bryan | -- | First American Title Insuran |
Source: Public Records
Tax History Compared to Growth
Tax History
| Year | Tax Paid | Tax Assessment Tax Assessment Total Assessment is a certain percentage of the fair market value that is determined by local assessors to be the total taxable value of land and additions on the property. | Land | Improvement |
|---|---|---|---|---|
| 2024 | $16,725 | $2,410,200 | -- | $2,410,200 |
| 2023 | $16,725 | $2,966,400 | $0 | $2,966,400 |
| 2022 | $13,833 | $2,100,000 | $700,000 | $1,400,000 |
| 2021 | $8,763 | $1,150,000 | $700,000 | $450,000 |
| 2020 | $9,302 | $1,150,000 | $700,000 | $450,000 |
| 2019 | $9,467 | $1,150,000 | $700,000 | $450,000 |
| 2018 | $10,290 | $1,250,000 | $800,000 | $450,000 |
| 2017 | $8,993 | $1,150,000 | $700,000 | $450,000 |
| 2016 | $9,239 | $1,150,000 | $700,000 | $450,000 |
| 2015 | $8,056 | $950,000 | $0 | $0 |
| 2013 | $6,822 | $750,000 | $0 | $0 |
Source: Public Records
Map
Nearby Homes
- 1164 Stonebridge Cir
- 1290 Pinnacle Dr
- 1365 Pinnacle Dr
- 690 Deer Valley Dr Unit 11
- 658 Rossie Hill Dr Unit 3
- 741 Rossie Hill Dr
- 755 Rossie Hill Dr
- 751 Rossie Hill Dr
- 1574 Deer Valley Dr N
- 1500 Deer Valley Dr N Unit 21
- 1582 Deer Valley Dr N
- 1551 Lakeside Cir
- 1612 Deer Valley Dr N
- 560 Deer Valley Dr
- 552 Deer Valley Dr
- 1450 Deer Valley Dr N
- 347 Mchenry St
- 347 Mchenry Ave
- 1219 Pinnacle Ct Unit 1219
- 1219 Pinnacle Ct Unit 3
- 1219 Pinnacle Ct
- 1201 Pinnacle Ct
- 1206 Pinnacle Condo Unit 34
- 1206 Pinnacle Dr Unit 34
- 1206 Pinnacle Dr
- 1186 Pinnacle Dr
- 1186 Pinnacle Dr Unit 1186
- 1186 Pinnacle Dr Unit 35
- 1257 Pinnacle Ct Unit 4
- 1257 Pinnacle Ct
- 1176 Pinnacle Dr Unit 1176
- 1176 Pinnacle Dr Unit 36
- 1230 Pinnacle Dr Unit 33
- 1166 Pinnacle Dr Unit 18
- 1166 Pinnacle Dr Unit 1166
- 1252 Pinnacle Ct Unit 13
- 1250 Pinnacle Dr Unit 1250
- 1250 Pinnacle Dr