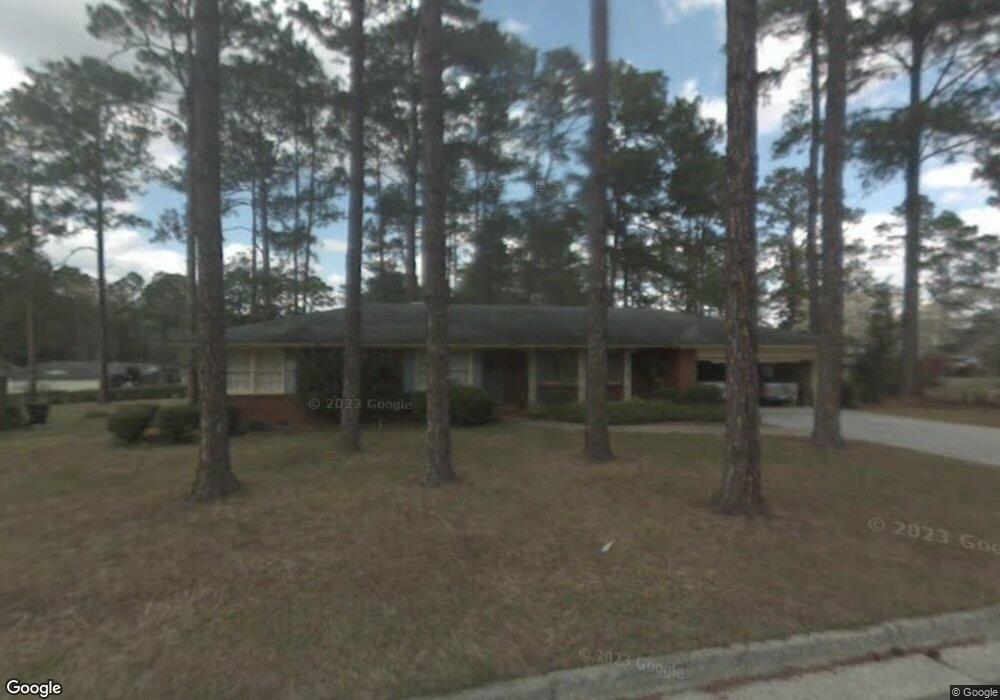
1207 Richmond Ave Waycross, GA 31501
Estimated Value: $216,299 - $224,000
4
Beds
3
Baths
2,124
Sq Ft
$103/Sq Ft
Est. Value
About This Home
This home is located at 1207 Richmond Ave, Waycross, GA 31501 and is currently estimated at $219,575, approximately $103 per square foot. 1207 Richmond Ave is a home located in Ware County with nearby schools including Williams Heights Elementary School, Waycross Middle School, and Ware County High School.
Ownership History
Date
Name
Owned For
Owner Type
Purchase Details
Closed on
Sep 24, 2021
Sold by
Braddock George Robert
Bought by
Fagin Galvin S
Current Estimated Value
Home Financials for this Owner
Home Financials are based on the most recent Mortgage that was taken out on this home.
Original Mortgage
$178,002
Outstanding Balance
$162,321
Interest Rate
2.8%
Mortgage Type
VA
Estimated Equity
$57,254
Purchase Details
Closed on
Sep 17, 2014
Sold by
Tingle Lisa M
Bought by
Braddock George
Home Financials for this Owner
Home Financials are based on the most recent Mortgage that was taken out on this home.
Original Mortgage
$102,920
Interest Rate
4.12%
Mortgage Type
FHA
Purchase Details
Closed on
Apr 10, 2008
Sold by
Minchew Gregory B
Bought by
Tingle Lisa M
Purchase Details
Closed on
Feb 27, 1995
Bought by
Minchew Delores J
Create a Home Valuation Report for This Property
The Home Valuation Report is an in-depth analysis detailing your home's value as well as a comparison with similar homes in the area
Home Values in the Area
Average Home Value in this Area
Purchase History
| Date | Buyer | Sale Price | Title Company |
|---|---|---|---|
| Fagin Galvin S | $174,000 | -- | |
| Braddock George | $105,000 | -- | |
| Tingle Lisa M | -- | -- | |
| Minchew Delores J | -- | -- |
Source: Public Records
Mortgage History
| Date | Status | Borrower | Loan Amount |
|---|---|---|---|
| Open | Fagin Galvin S | $178,002 | |
| Previous Owner | Braddock George | $102,920 |
Source: Public Records
Tax History Compared to Growth
Tax History
| Year | Tax Paid | Tax Assessment Tax Assessment Total Assessment is a certain percentage of the fair market value that is determined by local assessors to be the total taxable value of land and additions on the property. | Land | Improvement |
|---|---|---|---|---|
| 2024 | $2,269 | $67,169 | $6,720 | $60,449 |
| 2023 | $2,316 | $65,440 | $3,888 | $61,552 |
| 2022 | $2,608 | $65,440 | $3,888 | $61,552 |
| 2021 | $1,674 | $46,869 | $3,888 | $42,981 |
| 2020 | $1,687 | $44,720 | $3,888 | $40,832 |
| 2019 | $1,710 | $41,496 | $3,888 | $37,608 |
| 2018 | $1,727 | $40,153 | $3,888 | $36,265 |
| 2017 | $1,686 | $40,153 | $3,888 | $36,265 |
| 2016 | $1,686 | $40,153 | $3,888 | $36,265 |
| 2015 | $1,697 | $40,153 | $3,888 | $36,265 |
| 2014 | $1,761 | $40,153 | $3,888 | $36,265 |
| 2013 | -- | $42,364 | $3,888 | $38,476 |
Source: Public Records
Map
Nearby Homes
- 1204 Richmond Ave
- 1002 Baltimore Ave
- 807 City Blvd
- 1205 Dean Dr
- 1100 Euclid Ave
- 1100 Atlantic Ave
- 1312 Atlantic Ave
- 1009 Euclid Ave
- 00 Seminole Trail
- 903 Atlantic Ave
- 907 Euclid Ave
- 1001 Coral Rd
- 1502 Seminole Trail
- 1400 E Cherokee Dr
- 914 Barkley St
- 1504 Danora Dr
- 1621 Camellia Dr
- 0 Saint Marys Dr Unit (TRACT 2 0.25 ACRES)
- 713 Magnolia Dr
- Lot 3 City Blvd
- 1205 Richmond Ave
- 1210 Baltimore Ave
- 1208 Baltimore Ave
- 1203 Richmond Ave
- 1212 Baltimore Ave
- 1206 Baltimore Ave
- 1210 Richmond Ave
- 1212 Richmond Ave
- 1202 Richmond Ave
- 1204 Baltimore Ave
- 1100 Saint Catherine Dr
- 1100 Saint Catherine Dr
- 1005 City Blvd
- 1006 Saint Catherine's Dr
- 1207 Atlantic Ave
- 1006 Saint Catherine Dr
- 1209 Atlantic Ave
- 1209 Baltimore Ave
- 1211 Baltimore Ave
- 1200 Baltimore Ave