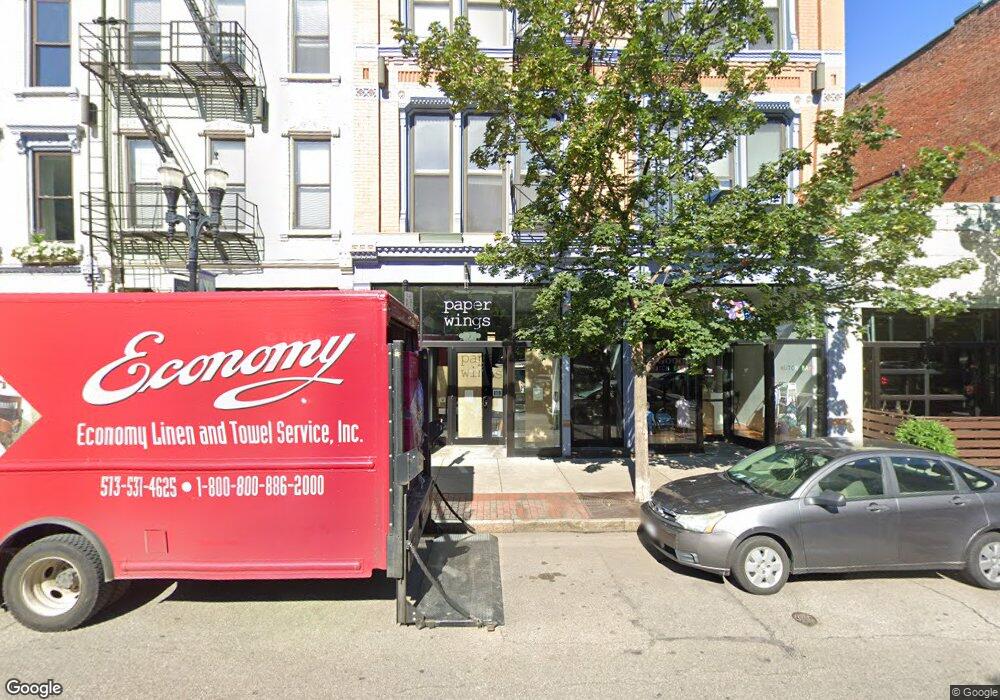
1207 Vine St Cincinnati, OH 45202
Over-The-Rhine NeighborhoodEstimated Value: $276,000 - $321,000
2
Beds
2
Baths
1,035
Sq Ft
$288/Sq Ft
Est. Value
About This Home
This home is located at 1207 Vine St, Cincinnati, OH 45202 and is currently estimated at $297,753, approximately $287 per square foot. 1207 Vine St is a home located in Hamilton County with nearby schools including Rothenberg Preparatory Academy, Robert A. Taft Information Technology High School, and Gilbert A. Dater High School.
Ownership History
Date
Name
Owned For
Owner Type
Purchase Details
Closed on
Aug 1, 2016
Sold by
Kamensky David
Bought by
Kenneth Morand and Mary Morand
Current Estimated Value
Home Financials for this Owner
Home Financials are based on the most recent Mortgage that was taken out on this home.
Original Mortgage
$196,000
Outstanding Balance
$85,092
Interest Rate
3.48%
Mortgage Type
New Conventional
Estimated Equity
$212,661
Purchase Details
Closed on
Jul 10, 2013
Sold by
Gulasy Stephen T and Gulasy Robyn
Bought by
Kamensky David
Home Financials for this Owner
Home Financials are based on the most recent Mortgage that was taken out on this home.
Original Mortgage
$154,000
Interest Rate
3.83%
Mortgage Type
New Conventional
Purchase Details
Closed on
Jun 26, 2009
Sold by
1200 Vine Llc
Bought by
Gulasy Stephen T
Home Financials for this Owner
Home Financials are based on the most recent Mortgage that was taken out on this home.
Original Mortgage
$120,800
Interest Rate
4.92%
Mortgage Type
New Conventional
Create a Home Valuation Report for This Property
The Home Valuation Report is an in-depth analysis detailing your home's value as well as a comparison with similar homes in the area
Home Values in the Area
Average Home Value in this Area
Purchase History
| Date | Buyer | Sale Price | Title Company |
|---|---|---|---|
| Kenneth Morand | $245,000 | -- | |
| Kamensky David | $192,500 | Prodigy Title Agency | |
| Gulasy Stephen T | -- | None Available |
Source: Public Records
Mortgage History
| Date | Status | Borrower | Loan Amount |
|---|---|---|---|
| Open | Kenneth Morand | $196,000 | |
| Previous Owner | Kamensky David | $154,000 | |
| Previous Owner | Gulasy Stephen T | $120,800 |
Source: Public Records
Tax History
| Year | Tax Paid | Tax Assessment Tax Assessment Total Assessment is a certain percentage of the fair market value that is determined by local assessors to be the total taxable value of land and additions on the property. | Land | Improvement |
|---|---|---|---|---|
| 2025 | $5,147 | $80,955 | $7,000 | $73,955 |
| 2023 | $5,195 | $80,955 | $7,000 | $73,955 |
| 2022 | $5,865 | $82,488 | $9,100 | $73,388 |
| 2021 | $5,638 | $82,488 | $9,100 | $73,388 |
| 2020 | $5,797 | $82,488 | $9,100 | $73,388 |
| 2019 | $6,325 | $85,750 | $9,100 | $76,650 |
| 2018 | $6,334 | $85,750 | $9,100 | $76,650 |
| 2017 | $755 | $85,750 | $9,100 | $76,650 |
| 2016 | $832 | $67,375 | $9,737 | $57,638 |
| 2015 | $739 | $67,375 | $9,737 | $57,638 |
| 2014 | $744 | $67,375 | $9,737 | $57,638 |
| 2013 | $684 | $52,850 | $9,100 | $43,750 |
Source: Public Records
Map
Nearby Homes
- 1207 Vine St Unit 1207C
- 1207 Vine St Unit 1207J
- 1207 Vine St
- 1207 Vine St
- 1207 Vine St
- 1207 Vine St
- 1207 Vine St
- 1207 Vine St Unit 1207G
- 1207 Vine St Unit F
- 1207 Vine St Unit G
- 1207 Vine St Unit C
- 1207 Vine St Unit E
- 1207 Vine St Unit J
- 1207 Vine St Unit K
- 1207 Vine St Unit D
- 1207 Vine St Unit I
- 1207 Vine St Unit H
- 1203 Vine St Unit B
- 1203 Vine St Unit 1203B
- 1205 Vine St
Your Personal Tour Guide
Ask me questions while you tour the home.