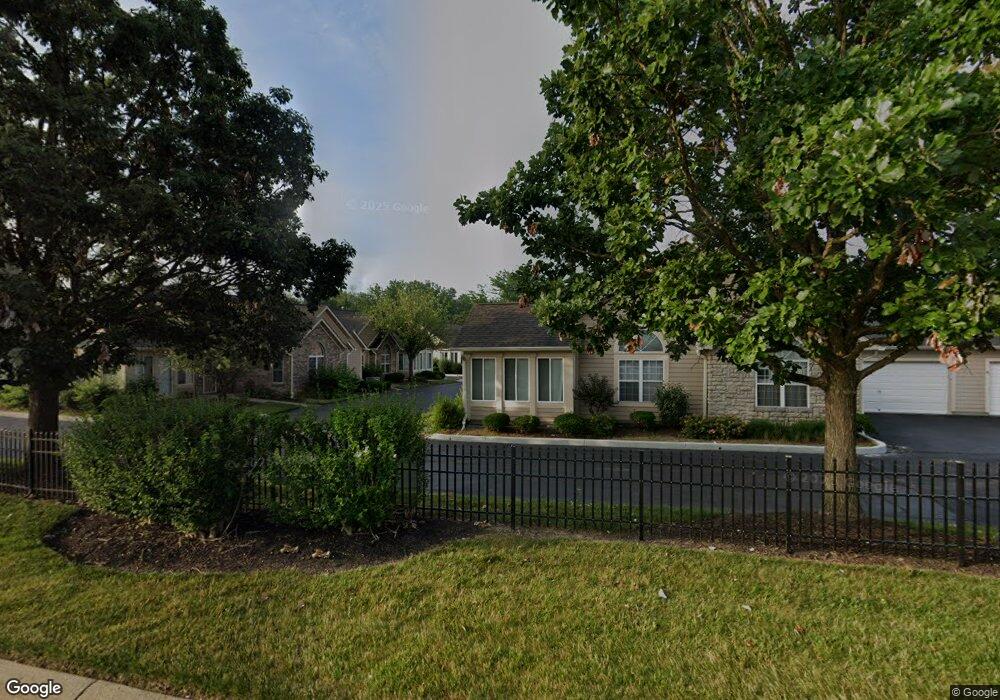
12076 Maxim Way Cincinnati, OH 45249
Highpoint NeighborhoodEstimated Value: $289,078 - $308,000
3
Beds
2
Baths
1,383
Sq Ft
$219/Sq Ft
Est. Value
About This Home
This home is located at 12076 Maxim Way, Cincinnati, OH 45249 and is currently estimated at $302,270, approximately $218 per square foot. 12076 Maxim Way is a home located in Hamilton County with nearby schools including Edwin H Greene Intermediate Middle School, Sycamore Junior High School, and Sycamore High School.
Ownership History
Date
Name
Owned For
Owner Type
Purchase Details
Closed on
Apr 30, 2019
Sold by
Estate Of Todd William Severtson
Bought by
Severtson Valerie Jill
Current Estimated Value
Purchase Details
Closed on
Mar 27, 2001
Sold by
Linda El Saleh and Linda Saad
Bought by
Severtson Todd and Severtson Valerie
Home Financials for this Owner
Home Financials are based on the most recent Mortgage that was taken out on this home.
Original Mortgage
$120,000
Outstanding Balance
$44,237
Interest Rate
7.02%
Estimated Equity
$258,033
Purchase Details
Closed on
Sep 16, 1997
Sold by
Royale Point Ltd
Bought by
El Saleh Linda and El Saleh Saad
Home Financials for this Owner
Home Financials are based on the most recent Mortgage that was taken out on this home.
Original Mortgage
$123,097
Interest Rate
7.63%
Create a Home Valuation Report for This Property
The Home Valuation Report is an in-depth analysis detailing your home's value as well as a comparison with similar homes in the area
Home Values in the Area
Average Home Value in this Area
Purchase History
| Date | Buyer | Sale Price | Title Company |
|---|---|---|---|
| Severtson Valerie Jill | -- | None Available | |
| Severtson Todd | $150,000 | Ohio Clear Title Agency Inc | |
| El Saleh Linda | $142,000 | -- |
Source: Public Records
Mortgage History
| Date | Status | Borrower | Loan Amount |
|---|---|---|---|
| Open | Severtson Todd | $120,000 | |
| Previous Owner | El Saleh Linda | $123,097 | |
| Closed | Severtson Todd | $30,000 |
Source: Public Records
Tax History Compared to Growth
Tax History
| Year | Tax Paid | Tax Assessment Tax Assessment Total Assessment is a certain percentage of the fair market value that is determined by local assessors to be the total taxable value of land and additions on the property. | Land | Improvement |
|---|---|---|---|---|
| 2024 | $3,913 | $80,752 | $14,210 | $66,542 |
| 2023 | $3,894 | $80,752 | $14,210 | $66,542 |
| 2022 | $3,356 | $56,609 | $11,368 | $45,241 |
| 2021 | $3,288 | $56,609 | $11,368 | $45,241 |
| 2020 | $3,318 | $56,609 | $11,368 | $45,241 |
| 2019 | $2,978 | $48,801 | $9,800 | $39,001 |
| 2018 | $2,864 | $48,801 | $9,800 | $39,001 |
| 2017 | $2,684 | $48,801 | $9,800 | $39,001 |
| 2016 | $2,885 | $50,540 | $12,250 | $38,290 |
| 2015 | $2,587 | $50,540 | $12,250 | $38,290 |
| 2014 | $2,570 | $50,540 | $12,250 | $38,290 |
| 2013 | $2,649 | $50,540 | $12,250 | $38,290 |
Source: Public Records
Map
Nearby Homes
- 11971 Olde Dominion Dr Unit 7
- 9141 Dominion Cir
- 9130 Dominion Cir
- 8936 Cypresspoint Ln
- 12016 Mason Rd
- 9160 Symmes Landing Dr
- 220 Carrington Ln
- 210 Carrington Ln
- 11724 Gable Glen Ln
- 11722 Gable Glen Ln
- 11730 Gable Glen Ln
- 11659 Symmes Valley Dr
- 11782 Gable Glen Ln
- 710 Carrington Place
- 12091 Carrington Ln
- 11783 Gable Glen Ln
- 210 Carrington Place
- 12084 Maxim Way Unit 12084
- 12016 Maxim Way
- 12010 Maxim Way Unit 12010
- 12064 Maxim Way Unit D12064
- 12075 Maxim Way Unit 12075
- 12066 Maxim Way Unit 12066
- 12060 Maxim Way
- 12062 Maxim Way
- 12012 Maxim Way
- 12015 Maxim Way Unit 12015
- 12016 Maxim Ave
- 12073 Maxim Way
- 12013 Maxim Way Unit 12013
- 12004 Maxim Way
- 12086 Maxim Way
- 12082 Maxim Way
- 12000 Maxim Way Unit 12000
- 12074 Maxim Way Unit 12074
- 12083 Maxim Way
- 12006 Maxim Way Unit 12006