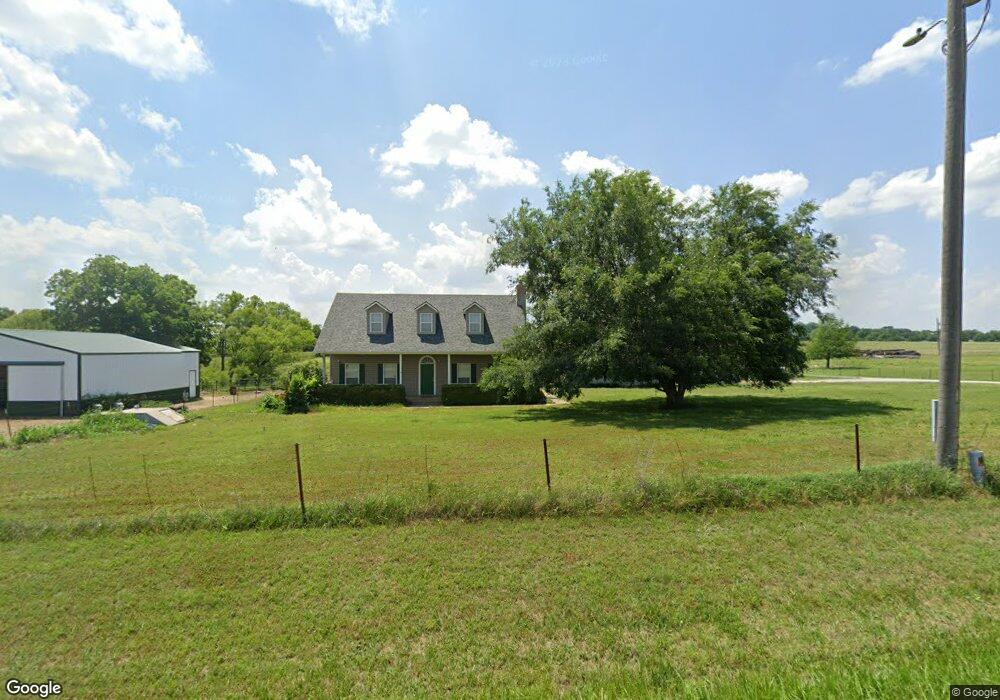
12076 N 52nd West Ave Skiatook, OK 74070
Estimated Value: $395,000 - $501,000
4
Beds
4
Baths
2,887
Sq Ft
$149/Sq Ft
Est. Value
About This Home
This home is located at 12076 N 52nd West Ave, Skiatook, OK 74070 and is currently estimated at $430,746, approximately $149 per square foot. 12076 N 52nd West Ave is a home located in Osage County with nearby schools including Sperry Elementary School, Sperry Middle School, and Sperry High School.
Ownership History
Date
Name
Owned For
Owner Type
Purchase Details
Closed on
Aug 14, 2019
Sold by
Ham Justin K and Ham Tisha M
Bought by
White Jerry and White Kyrstin
Current Estimated Value
Home Financials for this Owner
Home Financials are based on the most recent Mortgage that was taken out on this home.
Original Mortgage
$130,000
Outstanding Balance
$113,361
Interest Rate
3.7%
Mortgage Type
New Conventional
Estimated Equity
$317,385
Purchase Details
Closed on
Aug 14, 2009
Sold by
Drummond Heather R and Drummond Matt D
Bought by
Ham Justin K and Ham Tisha M
Purchase Details
Closed on
Dec 4, 2003
Sold by
Diskin Todd J and Diskin Wendy L
Bought by
Drummond Heather R and Drummond Mat D
Purchase Details
Closed on
Apr 30, 1999
Sold by
Overholt Bradford R
Bought by
Diskin Todd J and Diskin Wendy L
Purchase Details
Closed on
Jun 25, 1996
Sold by
Day Sadie C
Bought by
Overholt Bradford R
Create a Home Valuation Report for This Property
The Home Valuation Report is an in-depth analysis detailing your home's value as well as a comparison with similar homes in the area
Home Values in the Area
Average Home Value in this Area
Purchase History
| Date | Buyer | Sale Price | Title Company |
|---|---|---|---|
| White Jerry | $270,000 | Allegiance T&E Llc | |
| Ham Justin K | $242,000 | -- | |
| Drummond Heather R | $205,000 | -- | |
| Diskin Todd J | $147,500 | -- | |
| Overholt Bradford R | $20,000 | -- |
Source: Public Records
Mortgage History
| Date | Status | Borrower | Loan Amount |
|---|---|---|---|
| Open | White Jerry | $130,000 |
Source: Public Records
Tax History Compared to Growth
Tax History
| Year | Tax Paid | Tax Assessment Tax Assessment Total Assessment is a certain percentage of the fair market value that is determined by local assessors to be the total taxable value of land and additions on the property. | Land | Improvement |
|---|---|---|---|---|
| 2025 | $3,997 | $36,713 | $2,881 | $33,832 |
| 2024 | $3,524 | $32,400 | $2,743 | $29,657 |
| 2023 | $3,524 | $32,400 | $2,743 | $29,657 |
| 2022 | $3,510 | $32,400 | $2,743 | $29,657 |
| 2021 | $3,489 | $32,400 | $2,743 | $29,657 |
| 2020 | $3,493 | $32,400 | $2,743 | $29,657 |
| 2019 | $3,191 | $29,245 | $1,355 | $27,890 |
| 2018 | $3,189 | $29,245 | $1,355 | $27,890 |
| 2017 | $3,103 | $29,245 | $1,355 | $27,890 |
| 2016 | $3,062 | $28,992 | $1,355 | $27,637 |
| 2015 | $3,009 | $28,992 | $1,355 | $27,637 |
| 2014 | $3,024 | $28,992 | $1,355 | $27,637 |
| 2013 | $3,024 | $28,992 | $1,355 | $27,637 |
Source: Public Records
Map
Nearby Homes
- 11314 Scissortail Rd
- 11339 Forest View Ln
- 11375 Forest View Ln
- 11860 N 68th West Ave
- 12834 N 68th West Ave
- 12538 N 68th West Ave
- 8222 W 118th St N
- 3641 W Forest St
- 11 SE Lenapah St
- 3618 W Evergreen St
- 7 SE Lenapah St
- 6146 W 108th St N
- 1915 S Lenapah
- 1 Sunset View Dr
- 10 N Lenapah St
- 8 N Lenapah St
- 10739 N 25th West Ave
- 6 N Lenapah Ave
- 814 S Tall Chief Ave
- 40 Avalon Dr
- 12076 N 52nd Ave W
- 12124 N 52nd West Ave
- 11993 N 52nd West Ave
- 11940 N 52nd West Ave
- 11905 N 52nd West Ave
- 12296 N 52nd West Ave
- 11826 N 52nd West Ave
- 12191 N 52nd West Ave
- 16346 N 52nd West Ave
- 15158 N 52nd West Ave
- 14485 N 52nd West Ave
- 0 118th St Unit 1813347
- 5092 W 118th St N
- 11705 N 52nd West Ave
- 12491 N 52nd West Ave
- 11700 N 52nd West Ave
- 11690 N 57th West Ave
- 12182 Pacific Cir
- null N 118th St N
- 1007 Red Fox Ln