Estimated Value: $575,000 - $616,000
3
Beds
3
Baths
2,111
Sq Ft
$281/Sq Ft
Est. Value
About This Home
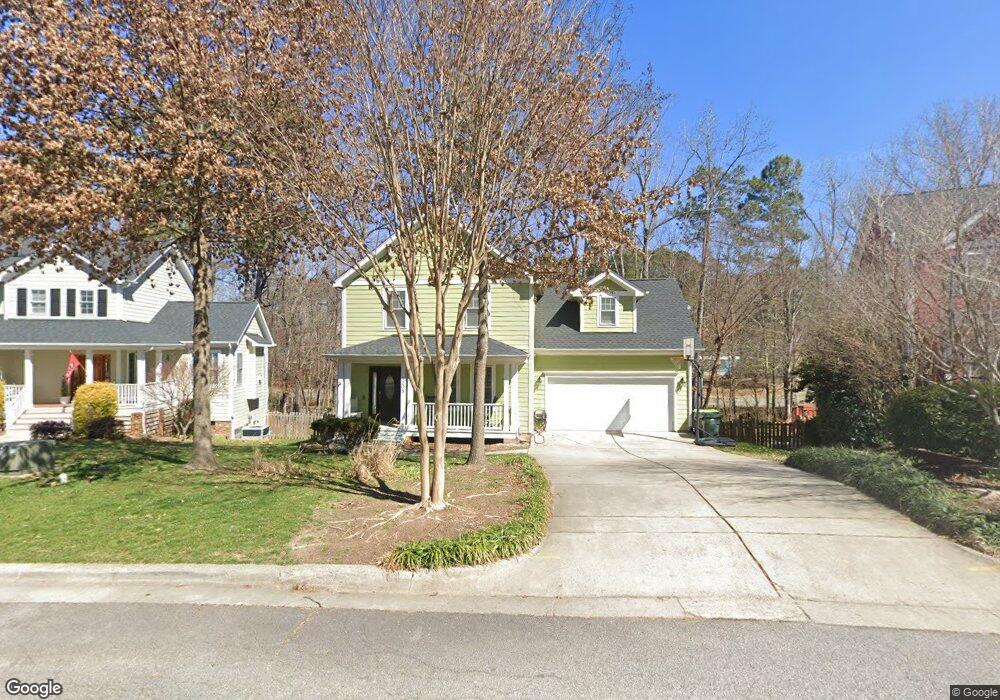
This home is located at 1208 Applethorn Dr, Apex, NC 27502 and is currently estimated at $593,756, approximately $281 per square foot. 1208 Applethorn Dr is a home located in Wake County with nearby schools including Baucom Elementary School, Apex Middle, and Apex High School.
Ownership History
Date
Name
Owned For
Owner Type
Purchase Details
Closed on
Jul 29, 2005
Sold by
Brg Builders Llc
Bought by
Griffin Michael T and Griffin Tracie S
Current Estimated Value
Home Financials for this Owner
Home Financials are based on the most recent Mortgage that was taken out on this home.
Original Mortgage
$217,850
Outstanding Balance
$110,443
Interest Rate
5.12%
Mortgage Type
Fannie Mae Freddie Mac
Estimated Equity
$483,313
Purchase Details
Closed on
Mar 30, 2005
Sold by
Canapex Llc
Bought by
Brg Builders Llc
Home Financials for this Owner
Home Financials are based on the most recent Mortgage that was taken out on this home.
Original Mortgage
$35,200
Interest Rate
5.57%
Mortgage Type
Construction
Create a Home Valuation Report for This Property
The Home Valuation Report is an in-depth analysis detailing your home's value as well as a comparison with similar homes in the area
Home Values in the Area
Average Home Value in this Area
Purchase History
| Date | Buyer | Sale Price | Title Company |
|---|---|---|---|
| Griffin Michael T | $276,500 | -- | |
| Brg Builders Llc | $43,000 | -- |
Source: Public Records
Mortgage History
| Date | Status | Borrower | Loan Amount |
|---|---|---|---|
| Open | Griffin Michael T | $217,850 | |
| Closed | Griffin Michael T | $40,850 | |
| Previous Owner | Brg Builders Llc | $35,200 |
Source: Public Records
Tax History Compared to Growth
Tax History
| Year | Tax Paid | Tax Assessment Tax Assessment Total Assessment is a certain percentage of the fair market value that is determined by local assessors to be the total taxable value of land and additions on the property. | Land | Improvement |
|---|---|---|---|---|
| 2025 | $4,863 | $554,660 | $190,000 | $364,660 |
| 2024 | $4,754 | $554,660 | $190,000 | $364,660 |
| 2023 | $3,877 | $351,594 | $60,000 | $291,594 |
| 2022 | $3,640 | $351,594 | $60,000 | $291,594 |
| 2021 | $3,501 | $351,594 | $60,000 | $291,594 |
| 2020 | $3,823 | $388,027 | $60,000 | $328,027 |
| 2019 | $4,067 | $356,324 | $60,000 | $296,324 |
| 2018 | $3,831 | $356,324 | $60,000 | $296,324 |
| 2017 | $3,565 | $356,324 | $60,000 | $296,324 |
| 2016 | $3,514 | $356,324 | $60,000 | $296,324 |
| 2015 | $3,399 | $336,358 | $52,000 | $284,358 |
| 2014 | $3,276 | $336,358 | $52,000 | $284,358 |
Source: Public Records
Map
Nearby Homes
- 1104 Barrow Nook Ct
- 1004 Marston Ct
- 1614 Brussels Dr
- 0 Jb Morgan Rd Unit 10051948
- 209 Homegate Cir
- 103 Garden Side Way
- 1434 Salem Creek Dr
- 1713 Yateley Ln
- 1464 Padstone Dr
- 410 2nd St
- 541 Village Loop Dr
- 1787 Flint Valley Ln
- 460 Heritage Village Ln
- 1844 Woodall Crest Dr
- 448 Heritage Village Ln
- 441 Heritage Village Ln
- 402 Village Loop Dr
- 406 S Salem St
- 428 Heritage Village Ln
- 1773 Town Home Dr
- 1210 Applethorn Dr
- 1206 Applethorn Dr
- 1212 Applethorn Dr
- 1204 Applethorn Dr
- 1001 Modest Way
- 1300 Applethorn Dr
- 1205 Applethorn Dr
- 1003 Modest Way
- 1202 Applethorn Dr
- 1003 Proper Ct
- 1203 Applethorn Dr
- 1301 Applethorn Dr
- 1302 Applethorn Dr
- 1005 Modest Way
- 1001 Proper Ct
- 1201 Applethorn Dr
- 1303 Applethorn Dr
- 1005 Proper Ct
- 1304 Applethorn Dr
- 1109 Elbury Dr