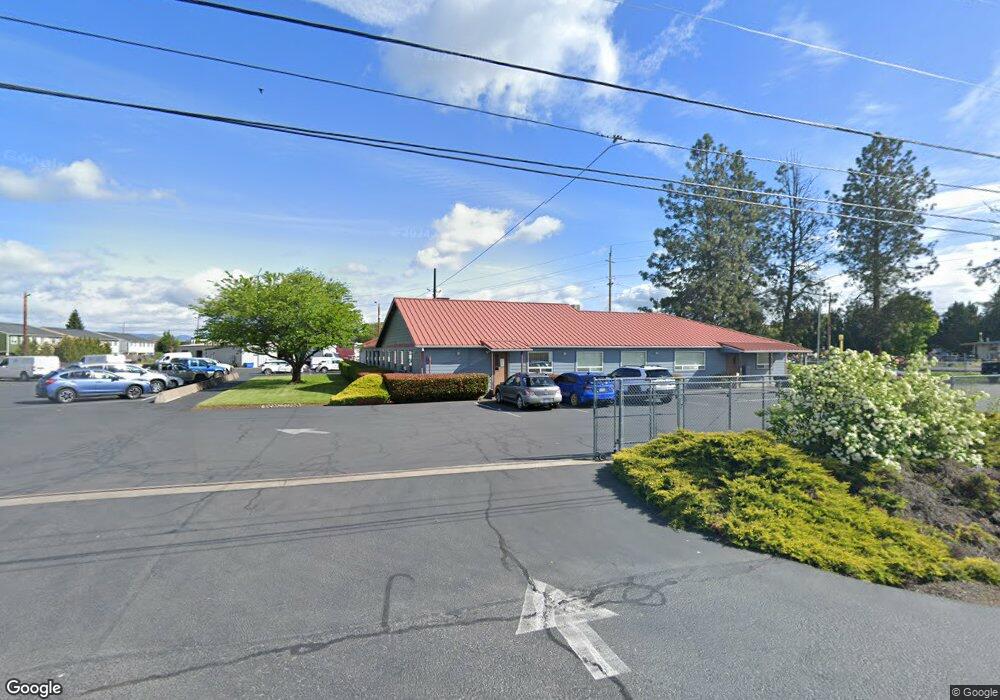
1208 Beall Ln Central Point, OR 97502
Estimated Value: $1,461,573
--
Bed
--
Bath
5,080
Sq Ft
$288/Sq Ft
Est. Value
About This Home
This home is located at 1208 Beall Ln, Central Point, OR 97502 and is currently estimated at $1,461,573, approximately $287 per square foot. 1208 Beall Ln is a home located in Jackson County with nearby schools including Richardson Elementary School, Scenic Middle School, and Crater High School.
Ownership History
Date
Name
Owned For
Owner Type
Purchase Details
Closed on
Aug 23, 2005
Sold by
Boise Building Solutions Mfg Llc
Bought by
Woody Family Properties Llc
Current Estimated Value
Home Financials for this Owner
Home Financials are based on the most recent Mortgage that was taken out on this home.
Original Mortgage
$350,000
Interest Rate
5.61%
Mortgage Type
Purchase Money Mortgage
Purchase Details
Closed on
Mar 18, 2004
Sold by
Vesta Enterprises Inc
Bought by
Decarlow Homes Inc
Purchase Details
Closed on
Jan 1, 2004
Sold by
Vesta Enterprises Inc
Bought by
Harkey Brandon and Harkey Christopher
Purchase Details
Closed on
Dec 30, 2003
Sold by
Capital Development 2002 Llc
Bought by
Pactrend Inc
Purchase Details
Closed on
Jun 26, 2003
Sold by
Capital Development 2002 Llc
Bought by
Mahar Brothers Construction Co Llc
Create a Home Valuation Report for This Property
The Home Valuation Report is an in-depth analysis detailing your home's value as well as a comparison with similar homes in the area
Home Values in the Area
Average Home Value in this Area
Purchase History
| Date | Buyer | Sale Price | Title Company |
|---|---|---|---|
| Woody Family Properties Llc | $960,000 | Amerititle | |
| Decarlow Homes Inc | -- | Lawyers Title Ins | |
| Harkey Brandon | $55,000 | Lawyers Title Insurance Corp | |
| Pactrend Inc | -- | -- | |
| Mahar Brothers Construction Co Llc | -- | -- |
Source: Public Records
Mortgage History
| Date | Status | Borrower | Loan Amount |
|---|---|---|---|
| Closed | Woody Family Properties Llc | $350,000 |
Source: Public Records
Tax History Compared to Growth
Tax History
| Year | Tax Paid | Tax Assessment Tax Assessment Total Assessment is a certain percentage of the fair market value that is determined by local assessors to be the total taxable value of land and additions on the property. | Land | Improvement |
|---|---|---|---|---|
| 2025 | $11,624 | $946,090 | $652,790 | $293,300 |
| 2024 | $11,624 | $918,540 | $633,790 | $284,750 |
| 2023 | $11,237 | $891,790 | $615,340 | $276,450 |
| 2022 | $10,998 | $891,790 | $615,340 | $276,450 |
| 2021 | $14,425 | $865,820 | $597,420 | $268,400 |
| 2020 | $13,697 | $1,101,730 | $761,210 | $340,520 |
| 2019 | $13,783 | $1,101,730 | $761,210 | $340,520 |
| 2018 | $14,173 | $1,110,290 | $838,220 | $272,070 |
| 2017 | $13,836 | $1,110,290 | $838,220 | $272,070 |
| 2016 | $13,432 | $1,046,570 | $790,120 | $256,450 |
| 2015 | $12,809 | $1,046,570 | $790,120 | $256,450 |
| 2014 | $12,500 | $986,500 | $504,420 | $482,080 |
Source: Public Records
Map
Nearby Homes
- 887 Silver Fox Dr
- 739 S Haskell St
- 1065 Edwina Ave
- 3600 N Pacific Hwy
- 3358 Bursell Rd
- 755 S 4th St
- 3364 Bursell Rd
- 2825 Duell Ave
- 745 Herman Ave
- 881 Westrop Dr
- 3364 Snowy Butte Ln
- 659 Herman Ave
- 114 Cedar St
- 895 Holley Way
- 871 Holley Way
- 851 Juanita Way
- 959 Westrop Dr
- 571 Briarwood Dr
- 531 Bush St
- 2711 Elliott Ave
- 927 Silver Fox Dr
- 921 Silver Fox Dr
- 141 Alta Ln
- 915 Silver Fox Dr
- 909 Silver Fox Dr
- 145 Alta Ln
- 903 Silver Fox Dr
- 901 Silver Fox Dr
- 1253 Beall Ln
- 899 Silver Fox Dr
- 149 Alta Ln
- 897 Silver Fox Dr
- 166 Alta Ln
- 895 Silver Fox Dr
- 0 Silver Fox Dr
- 893 Silver Fox Dr
- 906 Silver Fox Dr
- 153 Alta Ln
- 891 Silver Fox Dr
- 982 S Front St