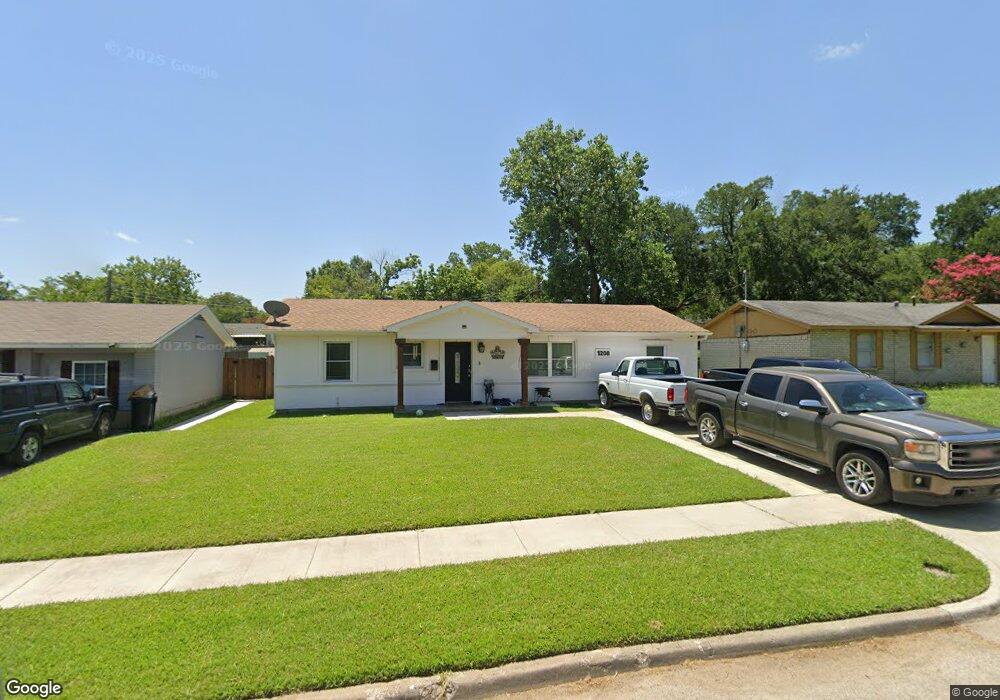
1208 Greenbrier Dr Mesquite, TX 75149
Estimated Value: $195,591 - $229,000
2
Beds
1
Bath
1,176
Sq Ft
$179/Sq Ft
Est. Value
About This Home
This home is located at 1208 Greenbrier Dr, Mesquite, TX 75149 and is currently estimated at $210,398, approximately $178 per square foot. 1208 Greenbrier Dr is a home located in Dallas County with nearby schools including Mcwhorter Elementary School, Lanny Frasier Middle, and West Mesquite High School.
Ownership History
Date
Name
Owned For
Owner Type
Purchase Details
Closed on
Sep 15, 2010
Sold by
Davis Riley Lee
Bought by
Muniz Emmanuel and Muniz Olivia
Current Estimated Value
Home Financials for this Owner
Home Financials are based on the most recent Mortgage that was taken out on this home.
Original Mortgage
$50,000
Outstanding Balance
$33,134
Interest Rate
4.51%
Mortgage Type
Seller Take Back
Estimated Equity
$177,264
Purchase Details
Closed on
Nov 3, 2009
Sold by
Vonner Willie and Vonner Keisha V
Bought by
Davis Riley Lee
Purchase Details
Closed on
Dec 1, 2004
Sold by
Davis Riley Lee
Bought by
Vonner Willie and Vonner Keisha
Home Financials for this Owner
Home Financials are based on the most recent Mortgage that was taken out on this home.
Original Mortgage
$57,000
Interest Rate
5.7%
Mortgage Type
Seller Take Back
Purchase Details
Closed on
Mar 1, 1996
Sold by
Davis Emma Lee Catlett
Bought by
Davis Riley L and Davis Riley Lee
Create a Home Valuation Report for This Property
The Home Valuation Report is an in-depth analysis detailing your home's value as well as a comparison with similar homes in the area
Home Values in the Area
Average Home Value in this Area
Purchase History
| Date | Buyer | Sale Price | Title Company |
|---|---|---|---|
| Muniz Emmanuel | -- | None Available | |
| Davis Riley Lee | $50,000 | None Available | |
| Vonner Willie | -- | -- | |
| Davis Riley L | -- | -- |
Source: Public Records
Mortgage History
| Date | Status | Borrower | Loan Amount |
|---|---|---|---|
| Open | Muniz Emmanuel | $50,000 | |
| Previous Owner | Vonner Willie | $57,000 |
Source: Public Records
Tax History Compared to Growth
Tax History
| Year | Tax Paid | Tax Assessment Tax Assessment Total Assessment is a certain percentage of the fair market value that is determined by local assessors to be the total taxable value of land and additions on the property. | Land | Improvement |
|---|---|---|---|---|
| 2025 | $1,532 | $200,200 | $60,000 | $140,200 |
| 2024 | $1,532 | $200,200 | $60,000 | $140,200 |
| 2023 | $1,532 | $159,740 | $45,000 | $114,740 |
| 2022 | $4,013 | $159,740 | $45,000 | $114,740 |
| 2021 | $3,274 | $124,140 | $30,000 | $94,140 |
| 2020 | $3,086 | $110,400 | $30,000 | $80,400 |
| 2019 | $2,924 | $100,470 | $19,000 | $81,470 |
| 2018 | $2,817 | $100,470 | $19,000 | $81,470 |
| 2017 | $2,215 | $79,060 | $15,000 | $64,060 |
| 2016 | $1,552 | $55,380 | $15,000 | $40,380 |
| 2015 | $956 | $55,970 | $15,000 | $40,970 |
| 2014 | $956 | $45,250 | $15,000 | $30,250 |
Source: Public Records
Map
Nearby Homes
- 1229 Greenbrier Dr
- 1222 Athens Dr
- 2441 Lindale Ln
- Lot 15 Central Park Ct
- Lot 14 Central Park Ct
- 1410 Athens Dr
- 2633 Dean St
- 2629 Dean St
- 2637 Dean St
- 11915 Carson Dr
- 2429 Hickory Tree Rd
- 1756 Julie Ct
- 1309 Woodcrest Dr
- 1325 Woodcrest Dr
- 1726 Hillcrest Ct
- 12802 Park Hill Ct
- 2510 Lora Ln
- 3109 Forestdale Ln
- 12001 Quail Dr
- 2511 Lora Ln
- 1212 Greenbrier Dr
- 1204 Greenbrier Dr
- 1200 Greenbrier Dr
- 1211 Briarwood Dr
- 1216 Greenbrier Dr
- 1215 Briarwood Dr
- 1207 Briarwood Dr
- 1219 Briarwood Dr
- 1209 Greenbrier Dr
- 1203 Briarwood Dr
- 1205 Greenbrier Dr
- 1220 Greenbrier Dr
- 1213 Greenbrier Dr
- 1201 Greenbrier Dr
- 1223 Briarwood Dr
- 1217 Greenbrier Dr
- 1224 Greenbrier Dr
- 1221 Greenbrier Dr
- 2304 Avis St
- 2308 Avis St