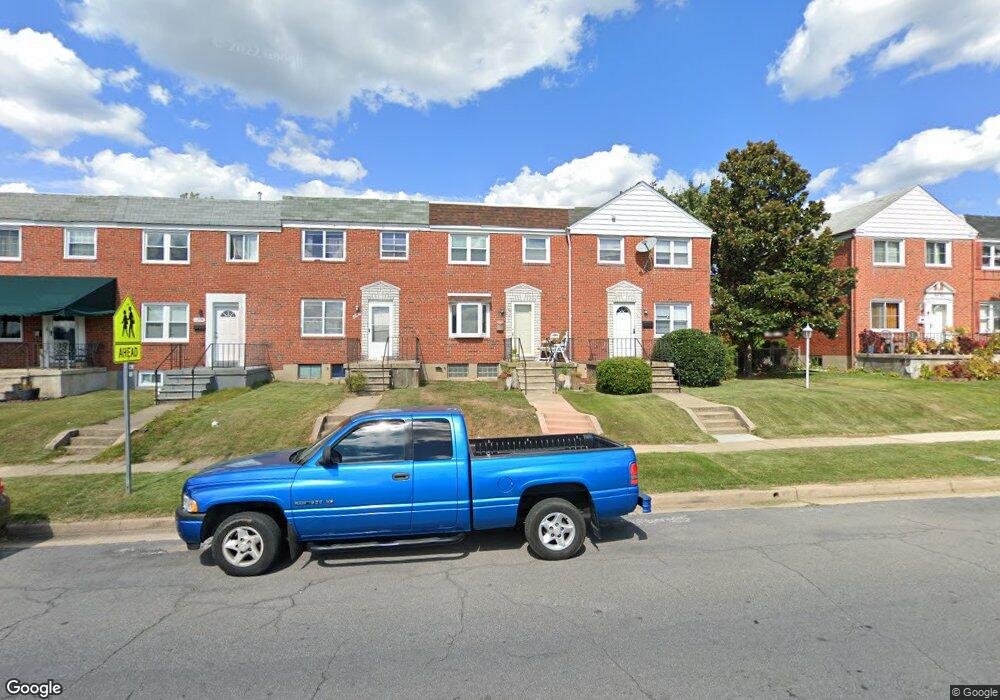
1208 Halstead Rd Parkville, MD 21234
Estimated Value: $212,000 - $252,000
--
Bed
1
Bath
1,152
Sq Ft
$201/Sq Ft
Est. Value
About This Home
This home is located at 1208 Halstead Rd, Parkville, MD 21234 and is currently estimated at $231,719, approximately $201 per square foot. 1208 Halstead Rd is a home located in Baltimore County with nearby schools including Halstead Academy, Loch Raven Technical Academy, and Parkville High School.
Ownership History
Date
Name
Owned For
Owner Type
Purchase Details
Closed on
Nov 15, 2006
Sold by
Milke Denise C
Bought by
Mcdaniel Charlene O
Current Estimated Value
Home Financials for this Owner
Home Financials are based on the most recent Mortgage that was taken out on this home.
Original Mortgage
$169,600
Outstanding Balance
$94,805
Interest Rate
5.25%
Mortgage Type
Purchase Money Mortgage
Estimated Equity
$136,914
Purchase Details
Closed on
Oct 10, 2006
Sold by
Milke Denise C
Bought by
Mcdaniel Charlene O
Home Financials for this Owner
Home Financials are based on the most recent Mortgage that was taken out on this home.
Original Mortgage
$169,600
Outstanding Balance
$94,805
Interest Rate
5.25%
Mortgage Type
Purchase Money Mortgage
Estimated Equity
$136,914
Purchase Details
Closed on
Oct 23, 2001
Sold by
Milke Charles L
Bought by
Milke Denise C
Purchase Details
Closed on
May 4, 1979
Sold by
Arnold Mildred U
Bought by
Milke Charles L
Create a Home Valuation Report for This Property
The Home Valuation Report is an in-depth analysis detailing your home's value as well as a comparison with similar homes in the area
Home Values in the Area
Average Home Value in this Area
Purchase History
| Date | Buyer | Sale Price | Title Company |
|---|---|---|---|
| Mcdaniel Charlene O | $174,900 | -- | |
| Mcdaniel Charlene O | $174,900 | -- | |
| Milke Denise C | $39,000 | -- | |
| Milke Charles L | $41,000 | -- |
Source: Public Records
Mortgage History
| Date | Status | Borrower | Loan Amount |
|---|---|---|---|
| Open | Mcdaniel Charlene O | $169,600 | |
| Closed | Mcdaniel Charlene O | $169,600 |
Source: Public Records
Tax History Compared to Growth
Tax History
| Year | Tax Paid | Tax Assessment Tax Assessment Total Assessment is a certain percentage of the fair market value that is determined by local assessors to be the total taxable value of land and additions on the property. | Land | Improvement |
|---|---|---|---|---|
| 2025 | $2,751 | $167,800 | $56,000 | $111,800 |
| 2024 | $2,751 | $161,500 | $0 | $0 |
| 2023 | $1,269 | $155,200 | $0 | $0 |
| 2022 | $2,763 | $148,900 | $56,000 | $92,900 |
| 2021 | $2,432 | $146,633 | $0 | $0 |
| 2020 | $2,432 | $144,367 | $0 | $0 |
| 2019 | $2,296 | $142,100 | $56,000 | $86,100 |
| 2018 | $2,387 | $140,167 | $0 | $0 |
| 2017 | $2,249 | $138,233 | $0 | $0 |
| 2016 | $1,901 | $136,300 | $0 | $0 |
| 2015 | $1,901 | $136,300 | $0 | $0 |
| 2014 | $1,901 | $136,300 | $0 | $0 |
Source: Public Records
Map
Nearby Homes
- 1211 Dalton Rd
- 1314 Mantle St
- 1331 Dalton Rd
- 1327 Mantle St
- 1304 Dartmouth Ave
- 1316 Dartmouth Ave
- 1931 Edgewood Rd
- 1860 Loch Shiel Rd
- 1700 Goodview Rd
- 1810 Wentworth Rd
- 8101 Hillendale Rd
- 1815 Wentworth Rd
- 8109 Hillendale Rd
- 1641 Cottage Ln
- 6702 Queens Ferry Rd
- 8324 Loch Raven Blvd
- 1602 Glen Keith Blvd
- 8217 Pleasant Plains Rd
- 8328 Wyton Rd
- 1847 Wycliffe Rd
- 1206 Halstead Rd
- 1210 Halstead Rd
- 1204 Halstead Rd
- 1212 Halstead Rd
- 1202 Halstead Rd
- 1214 Halstead Rd
- 1200 Halstead Rd
- 1216 Halstead Rd
- 1218 Halstead Rd
- 1211 Deanwood Rd
- 1209 Deanwood Rd
- 1213 Deanwood Rd
- 1207 Deanwood Rd
- 1148 Halstead Rd
- 1215 Deanwood Rd
- 1220 Halstead Rd
- 1205 Deanwood Rd
- 1203 Deanwood Rd
- 1217 Deanwood Rd
- 1222 Halstead Rd