Estimated Value: $134,000 - $196,000
3
Beds
1
Bath
1,154
Sq Ft
$140/Sq Ft
Est. Value
About This Home
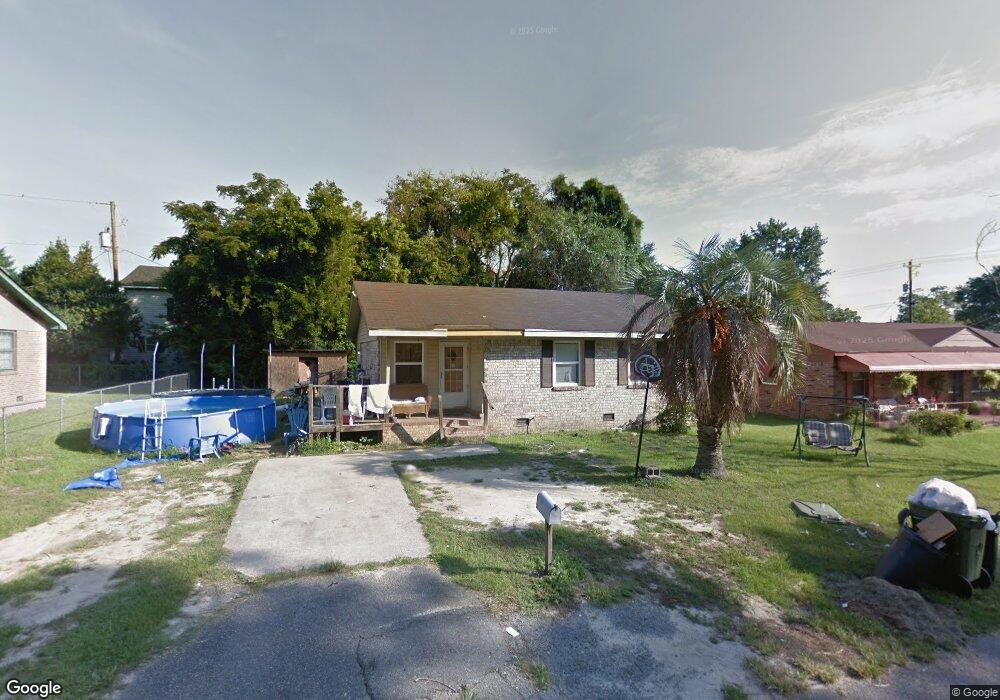
This home is located at 1208 Hemlock St, Cayce, SC 29033 and is currently estimated at $162,013, approximately $140 per square foot. 1208 Hemlock St is a home located in Lexington County with nearby schools including Cayce Elementary, Cyril B. Busbee Creative Arts Academy, and Brookland-Cayce High School.
Ownership History
Date
Name
Owned For
Owner Type
Purchase Details
Closed on
Sep 20, 2007
Sold by
Stubbs Mel
Bought by
Middleton Chandra
Current Estimated Value
Home Financials for this Owner
Home Financials are based on the most recent Mortgage that was taken out on this home.
Original Mortgage
$72,750
Outstanding Balance
$45,347
Interest Rate
6.27%
Mortgage Type
Purchase Money Mortgage
Estimated Equity
$116,666
Purchase Details
Closed on
Feb 13, 2007
Sold by
U S Bank Na
Bought by
Stubbs Mel
Home Financials for this Owner
Home Financials are based on the most recent Mortgage that was taken out on this home.
Original Mortgage
$60,000
Interest Rate
6.12%
Mortgage Type
Purchase Money Mortgage
Purchase Details
Closed on
Nov 14, 2006
Sold by
Watson Wallace and Jamison Jessie P
Bought by
U S Bank Na
Purchase Details
Closed on
May 13, 1999
Sold by
Bennett Richard E
Bought by
Watson Wallace
Purchase Details
Closed on
Feb 13, 1998
Sold by
Master In Equity
Bought by
Bennett Richard E
Create a Home Valuation Report for This Property
The Home Valuation Report is an in-depth analysis detailing your home's value as well as a comparison with similar homes in the area
Home Values in the Area
Average Home Value in this Area
Purchase History
| Date | Buyer | Sale Price | Title Company |
|---|---|---|---|
| Middleton Chandra | $75,000 | Attorney | |
| Stubbs Mel | $36,500 | None Available | |
| U S Bank Na | $45,000 | None Available | |
| Watson Wallace | $54,500 | -- | |
| Bennett Richard E | $20,000 | -- |
Source: Public Records
Mortgage History
| Date | Status | Borrower | Loan Amount |
|---|---|---|---|
| Open | Middleton Chandra | $72,750 | |
| Previous Owner | Stubbs Mel | $60,000 |
Source: Public Records
Tax History Compared to Growth
Tax History
| Year | Tax Paid | Tax Assessment Tax Assessment Total Assessment is a certain percentage of the fair market value that is determined by local assessors to be the total taxable value of land and additions on the property. | Land | Improvement |
|---|---|---|---|---|
| 2024 | $442 | $2,220 | $560 | $1,660 |
| 2023 | $400 | $2,220 | $560 | $1,660 |
| 2022 | $396 | $2,220 | $560 | $1,660 |
| 2020 | $386 | $2,220 | $560 | $1,660 |
| 2019 | $419 | $2,357 | $560 | $1,797 |
| 2018 | $414 | $2,357 | $560 | $1,797 |
| 2017 | $399 | $2,357 | $560 | $1,797 |
| 2016 | $406 | $2,356 | $560 | $1,796 |
| 2014 | $375 | $2,978 | $800 | $2,178 |
| 2013 | -- | $2,980 | $800 | $2,180 |
Source: Public Records
Map
Nearby Homes
- 1204 Hemlock St
- 1212 Hemlock St
- 2339 Lee St
- 2340 Julius Felder St
- 1200 Hemlock St
- 2335 Lee St
- 2338 Julius Felder St
- 1205 Hemlock St
- 1209 Hemlock St
- 2400 Julius Felder St
- 2404 Julius Felder St
- 2333 Lee St
- 1213 Hemlock St
- 2334 Julius Felder St
- 2336 Julius Felder St
- 1216 Hemlock St
- 1217 Hemlock St
- 2331 Lee St
- 2332 Julius Felder St
- 2339 Julius Felder St