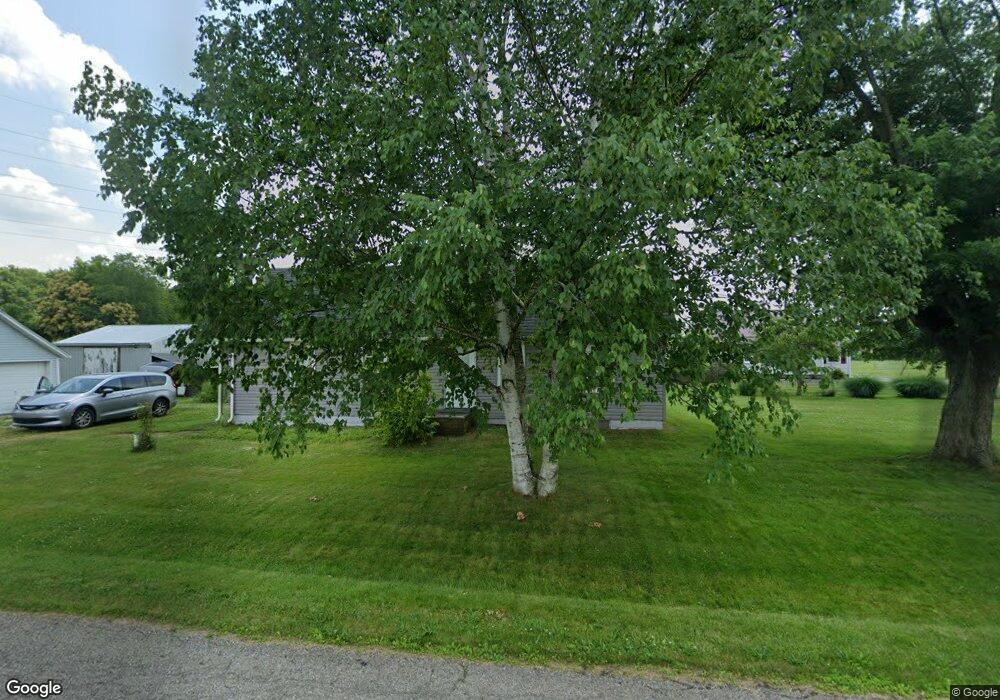
1208 Mattie St SE Canton, OH 44707
Estimated Value: $139,000 - $185,000
3
Beds
1
Bath
1,516
Sq Ft
$107/Sq Ft
Est. Value
About This Home
This home is located at 1208 Mattie St SE, Canton, OH 44707 and is currently estimated at $162,903, approximately $107 per square foot. 1208 Mattie St SE is a home located in Stark County with nearby schools including Faircrest Memorial Elementary School, Canton South High School, and Beacon Academy.
Ownership History
Date
Name
Owned For
Owner Type
Purchase Details
Closed on
Sep 14, 2017
Sold by
Mayle Paula L
Bought by
Chitchley Melvin R
Current Estimated Value
Purchase Details
Closed on
Jun 27, 2011
Sold by
Fannie Mae
Bought by
Critchley Melvin R and Mayle Paula L
Purchase Details
Closed on
Aug 25, 2010
Sold by
Addington Paul
Bought by
Federal National Mortgage Association
Purchase Details
Closed on
Dec 13, 2006
Sold by
Wilson William E and Wilson Lori A
Bought by
Wilson William E and Wilson Lori A
Home Financials for this Owner
Home Financials are based on the most recent Mortgage that was taken out on this home.
Original Mortgage
$109,900
Interest Rate
6.33%
Mortgage Type
Purchase Money Mortgage
Purchase Details
Closed on
May 19, 2006
Sold by
Sickafoose Gregory A and Sickafoose Donna
Bought by
Wilson William E and Wilson Lori A
Create a Home Valuation Report for This Property
The Home Valuation Report is an in-depth analysis detailing your home's value as well as a comparison with similar homes in the area
Home Values in the Area
Average Home Value in this Area
Purchase History
| Date | Buyer | Sale Price | Title Company |
|---|---|---|---|
| Chitchley Melvin R | $45,300 | None Available | |
| Critchley Melvin R | $40,500 | Omega Title Agency Llc | |
| Federal National Mortgage Association | $56,000 | Attorney | |
| Wilson William E | -- | Mk Land Title Inc | |
| Addington Paul | $109,900 | None Available | |
| Wilson William E | $53,500 | None Available |
Source: Public Records
Mortgage History
| Date | Status | Borrower | Loan Amount |
|---|---|---|---|
| Previous Owner | Addington Paul | $109,900 |
Source: Public Records
Tax History Compared to Growth
Tax History
| Year | Tax Paid | Tax Assessment Tax Assessment Total Assessment is a certain percentage of the fair market value that is determined by local assessors to be the total taxable value of land and additions on the property. | Land | Improvement |
|---|---|---|---|---|
| 2025 | -- | $52,470 | $7,910 | $44,560 |
| 2024 | -- | $52,470 | $7,910 | $44,560 |
| 2023 | $1,834 | $40,640 | $7,700 | $32,940 |
| 2022 | $1,701 | $40,640 | $7,700 | $32,940 |
| 2021 | $1,708 | $40,640 | $7,700 | $32,940 |
| 2020 | $1,599 | $33,390 | $6,510 | $26,880 |
| 2019 | $1,623 | $33,400 | $6,510 | $26,890 |
| 2018 | $1,610 | $33,400 | $6,510 | $26,890 |
| 2017 | $5,545 | $31,730 | $6,060 | $25,670 |
| 2016 | $7,504 | $31,730 | $6,060 | $25,670 |
| 2015 | $1,532 | $28,470 | $6,060 | $22,410 |
| 2014 | $1,353 | $24,800 | $5,290 | $19,510 |
| 2013 | $682 | $24,800 | $5,290 | $19,510 |
Source: Public Records
Map
Nearby Homes
- 1611 Village St SE
- 634 Figueroa Place SE
- 132 33rd St SE
- 1926 Village St SE
- 3673 Highview Ave SW
- 223 Faircrest St SW
- 236 32nd St SW
- 711 Somerset Ave SW
- 312 28th St SW
- 2122 Millerton St SE
- 331 Millview Place SW
- 207 51st St SW
- 1417 Bravado Rd SW
- 1521 Bravado Rd SW
- 2511 Sherr Ave SE
- 4805 Harvest Cir SE
- 5346 Shaker Valley Cir SE
- 5139 Derby Cir SE
- 5327 Dunfred Cir SE
- 5333 Dunfred Cir SE
- 3412 Gonder Ave SE
- 1304 Mattie St SE
- 1308 Mattie St SE
- 1309 Mattie St SE
- 1140 Mattie St SE
- 1314 Mattie St SE
- 1317 Mattie St SE
- 1139 Mattie St SE
- 1328 Mattie St SE
- 1313 Mattie St SE
- 1121 Mattie St SE
- 1408 Mattie St SE
- 1100 Mattie St SE
- 3329 Gonder Ave SE
- 3416 Robin Ct SE
- 1420 Mattie St SE
- 1228 Churchmont St SE
- 3500 Robin Ct SE
- 1405 Mattie St SE
- 1105 Mattie St SE