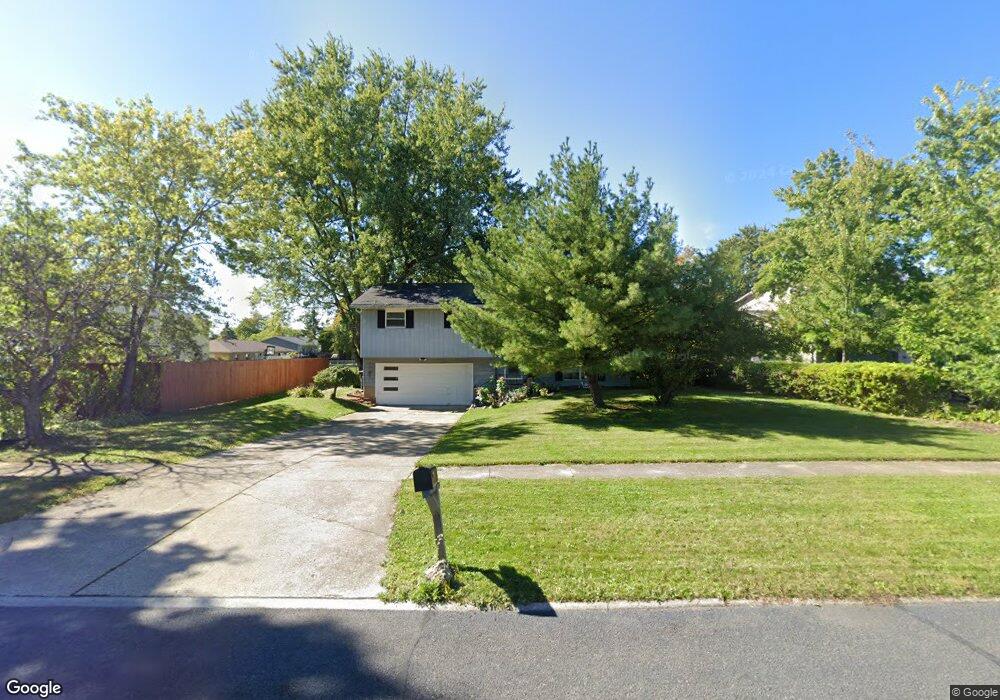
1208 Monroe Dr Brunswick, OH 44212
Estimated Value: $280,617 - $307,000
3
Beds
2
Baths
1,764
Sq Ft
$168/Sq Ft
Est. Value
About This Home
This home is located at 1208 Monroe Dr, Brunswick, OH 44212 and is currently estimated at $296,654, approximately $168 per square foot. 1208 Monroe Dr is a home located in Medina County with nearby schools including C.R. Towslee Elementary School, Willets Middle School, and Brunswick High School.
Ownership History
Date
Name
Owned For
Owner Type
Purchase Details
Closed on
Jul 31, 2009
Sold by
Madaleno Jorge F
Bought by
Pugh Chet E
Current Estimated Value
Home Financials for this Owner
Home Financials are based on the most recent Mortgage that was taken out on this home.
Original Mortgage
$123,717
Outstanding Balance
$78,948
Interest Rate
5.36%
Mortgage Type
FHA
Estimated Equity
$217,706
Purchase Details
Closed on
May 21, 2002
Sold by
Ravanelli Michael J and Ravanelli Mary E
Bought by
Madaleno Jorge F
Home Financials for this Owner
Home Financials are based on the most recent Mortgage that was taken out on this home.
Original Mortgage
$107,200
Interest Rate
7.07%
Purchase Details
Closed on
Jan 12, 1995
Sold by
Soeder Susan S
Bought by
Ravanelli Michael J and Ravanelli Mary E
Home Financials for this Owner
Home Financials are based on the most recent Mortgage that was taken out on this home.
Original Mortgage
$104,000
Interest Rate
8%
Mortgage Type
New Conventional
Create a Home Valuation Report for This Property
The Home Valuation Report is an in-depth analysis detailing your home's value as well as a comparison with similar homes in the area
Home Values in the Area
Average Home Value in this Area
Purchase History
We collect this data history from publicly available records. To have your information removed, we recommend requesting removal directly through your county’s website.
| Date | Buyer | Sale Price | Title Company |
|---|---|---|---|
| Pugh Chet E | $126,000 | -- | |
| Madaleno Jorge F | $134,000 | Premier Title Agency | |
| Ravanelli Michael J | $109,500 | -- |
Source: Public Records
Mortgage History
We collect this data history from publicly available records. To have your information removed, we recommend requesting removal directly through your county’s website.
| Date | Status | Borrower | Loan Amount |
|---|---|---|---|
| Open | Pugh Chet E | $123,717 | |
| Previous Owner | Madaleno Jorge F | $107,200 | |
| Previous Owner | Ravanelli Michael J | $104,000 |
Source: Public Records
Tax History
| Year | Tax Paid | Tax Assessment Tax Assessment Total Assessment is a certain percentage of the fair market value that is determined by local assessors to be the total taxable value of land and additions on the property. | Land | Improvement |
|---|---|---|---|---|
| 2025 | $3,655 | $80,070 | $24,500 | $55,570 |
| 2024 | $3,655 | $63,570 | $21,170 | $42,400 |
| 2023 | $3,143 | $63,570 | $21,170 | $42,400 |
| 2022 | $4,160 | $63,570 | $21,170 | $42,400 |
| 2021 | $3,724 | $50,450 | $16,800 | $33,650 |
| 2020 | $3,268 | $50,450 | $16,800 | $33,650 |
| 2019 | $3,248 | $50,450 | $16,800 | $33,650 |
| 2018 | $3,215 | $42,050 | $15,610 | $26,440 |
| 2017 | $3,107 | $42,050 | $15,610 | $26,440 |
| 2016 | $2,857 | $42,050 | $15,610 | $26,440 |
| 2015 | $3,289 | $38,940 | $14,460 | $24,480 |
| 2014 | $2,781 | $38,940 | $14,460 | $24,480 |
| 2013 | $2,736 | $38,940 | $14,460 | $24,480 |
Source: Public Records
Map
Nearby Homes
- 3256 Valley Forge Dr
- 3498 Varmland Ct
- 894 N Carpenter Rd
- 3320 White Willow Ln
- 3374 White Willow Ln
- 883 White Willow Ln
- 875 White Willow Ln
- 3312 White Willow Ln
- 3357 James Blvd
- 1137 Warren Dr
- 1668 Eisenhower Dr
- 3669 Sandlewood Dr
- 1754 Truman Dr
- 3519 Monterey Cir
- 1325 Hadcock Rd
- 3671 Ascot Dr
- 3802 Bramblewood Dr
- 3494 Monterey Cir
- 3811 Bramblewood Dr
- 3183 Blossom Trail Dr
- 1200 Monroe Dr
- 3251 Valley Forge Dr
- 3259 Valley Forge Dr
- 1192 Monroe Dr
- 1209 Clay Ct
- 3267 Valley Forge Dr
- 1201 Clay Ct
- 1207 Monroe Dr
- 1199 Monroe Dr
- 3275 Valley Forge Dr
- 1191 Monroe Dr
- 1184 Monroe Dr
- 1193 Clay Ct
- 1183 Monroe Dr
- 3229 Valley Forge Dr
- 1176 Monroe Dr
- 1183 Clay Ct
- 3262 Valley Forge Dr
- 3248 Valley Forge Dr
- 1177 Monroe Dr
Your Personal Tour Guide
Ask me questions while you tour the home.