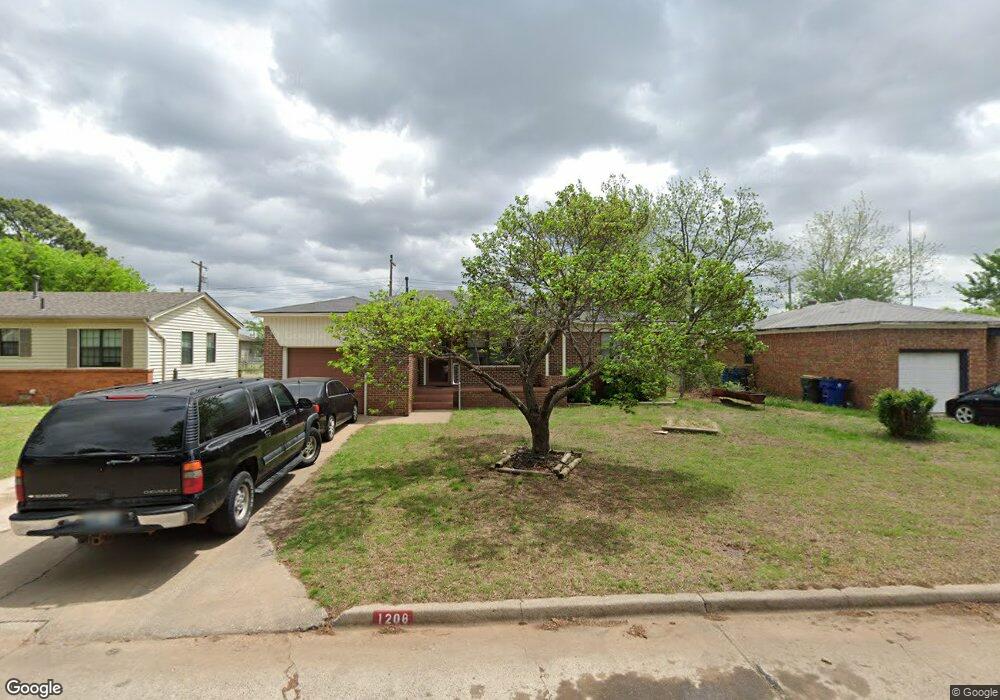
1208 N 20th St Duncan, OK 73533
Estimated Value: $74,000 - $85,000
3
Beds
1
Bath
999
Sq Ft
$80/Sq Ft
Est. Value
About This Home
This home is located at 1208 N 20th St, Duncan, OK 73533 and is currently estimated at $79,840, approximately $79 per square foot. 1208 N 20th St is a home located in Stephens County with nearby schools including Horace Mann Elementary School, Duncan Middle School, and Duncan High School.
Ownership History
Date
Name
Owned For
Owner Type
Purchase Details
Closed on
Jul 2, 2025
Sold by
Ballard Vicki Jo
Bought by
Sutterfield Property Holdings Llc
Current Estimated Value
Purchase Details
Closed on
Jun 1, 2012
Sold by
Earls Joe R and Earls J
Bought by
Ballard Vicki Jo
Purchase Details
Closed on
Nov 8, 2010
Sold by
Adams Mark
Bought by
Earls Joe R and Earls Doris
Purchase Details
Closed on
Jul 7, 2010
Sold by
First National Bank In Marlow
Bought by
Adams Mark and Adams Irrevocable Trust
Purchase Details
Closed on
Jun 18, 2010
Sold by
Barnett Romanda
Bought by
First National Bank
Purchase Details
Closed on
Nov 5, 2009
Sold by
Estate Of Ronald Allmon
Bought by
Bank In Marlow
Purchase Details
Closed on
Jul 9, 2009
Sold by
Allmon Ronald
Bought by
First National Bank In Marlow
Purchase Details
Closed on
Apr 18, 2003
Sold by
Vonvon Simms Kelly Von and Simms Aida
Purchase Details
Closed on
Aug 20, 1993
Sold by
Peck Karen C
Create a Home Valuation Report for This Property
The Home Valuation Report is an in-depth analysis detailing your home's value as well as a comparison with similar homes in the area
Home Values in the Area
Average Home Value in this Area
Purchase History
| Date | Buyer | Sale Price | Title Company |
|---|---|---|---|
| Sutterfield Property Holdings Llc | $80,000 | None Listed On Document | |
| Sutterfield Property Holdings Llc | $80,000 | None Listed On Document | |
| Ballard Vicki Jo | -- | None Available | |
| Ballard Vicki Jo | -- | None Available | |
| Earls Joe R | $55,000 | None Available | |
| Adams Mark | $29,500 | None Available | |
| First National Bank | -- | None Available | |
| Bank In Marlow | $29,500 | None Available | |
| First National Bank In Marlow | $19,666 | None Available | |
| -- | $35,000 | -- | |
| -- | $22,000 | -- |
Source: Public Records
Tax History Compared to Growth
Tax History
| Year | Tax Paid | Tax Assessment Tax Assessment Total Assessment is a certain percentage of the fair market value that is determined by local assessors to be the total taxable value of land and additions on the property. | Land | Improvement |
|---|---|---|---|---|
| 2025 | $528 | $6,259 | $549 | $5,710 |
| 2024 | $508 | $5,961 | $549 | $5,412 |
| 2023 | $508 | $5,961 | $549 | $5,412 |
| 2022 | $460 | $5,678 | $549 | $5,129 |
| 2021 | $460 | $5,407 | $549 | $4,858 |
| 2020 | $424 | $4,905 | $549 | $4,356 |
| 2019 | $416 | $4,808 | $549 | $4,259 |
| 2018 | $428 | $4,808 | $549 | $4,259 |
| 2017 | $462 | $5,380 | $549 | $4,831 |
| 2016 | $465 | $5,475 | $549 | $4,926 |
| 2015 | $522 | $5,475 | $549 | $4,926 |
| 2014 | $522 | $5,475 | $549 | $4,926 |
Source: Public Records
Map
Nearby Homes
- 1212 N 21st St
- 1902 W Randall Ave
- 1807 W Chisholm Dr
- 1309 Whisenant Ct
- 1099 N 19th St
- 2204 W Parkview Ave
- 2206 W Spruce Ave
- 2120 Flamingo Ln
- 2202 W Canary Ave
- 2203 Canary Ave
- 815 N 14th St
- 1405 Evergreen Dr
- 2210 Western Dr
- 1404 Aspen Ave
- 507 N Alice Dr
- 1105 N Grand Blvd
- 1202 N Grand Blvd
- 2129 W Mallard Dr
- 1508 N 13th St
- 2201 Mallard
- 1206 N 20th St
- 1210 N 20th St
- 1207 N 19th St
- 1212 N 20th St
- 1204 N 20th St
- 1209 N 19th St
- 1205 N 19th St
- 1207 1207 N 20th
- 1211 N 19th St
- 1207 N 20th St
- 1203 N 19th St
- 1209 N 20th St
- 1205 N 20th St
- 2001 W Randall Ave
- 1214 N 20th St
- 1213 N 19th St
- 1211 N 20th St
- 1203 N 20th St
- 1201 N 19th St
- 1216 N 20th St