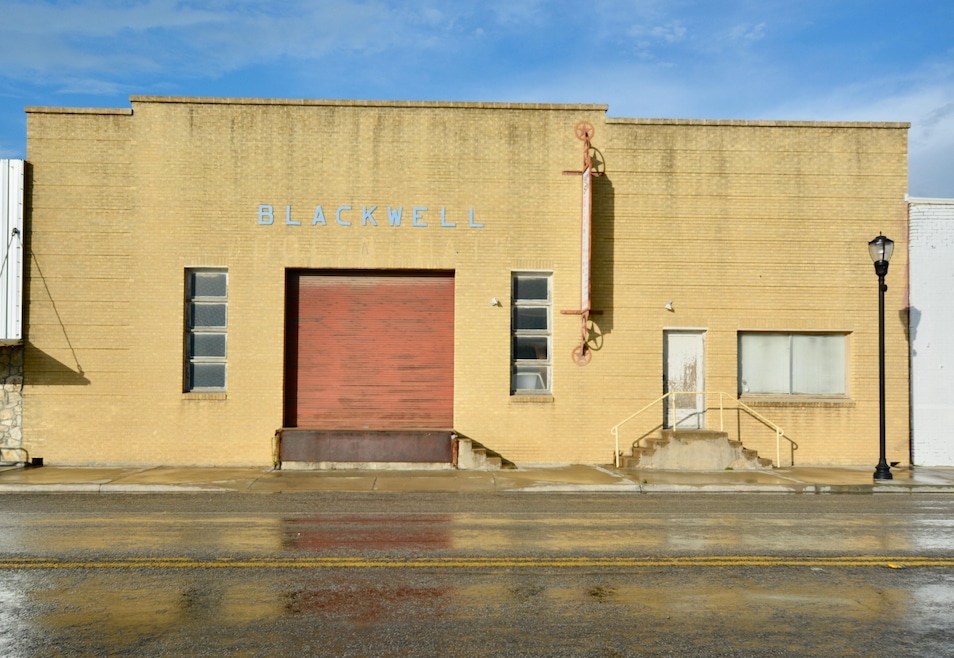

1208 N Fisher Goldthwaite, TX 76844
Estimated payment $1,728/month
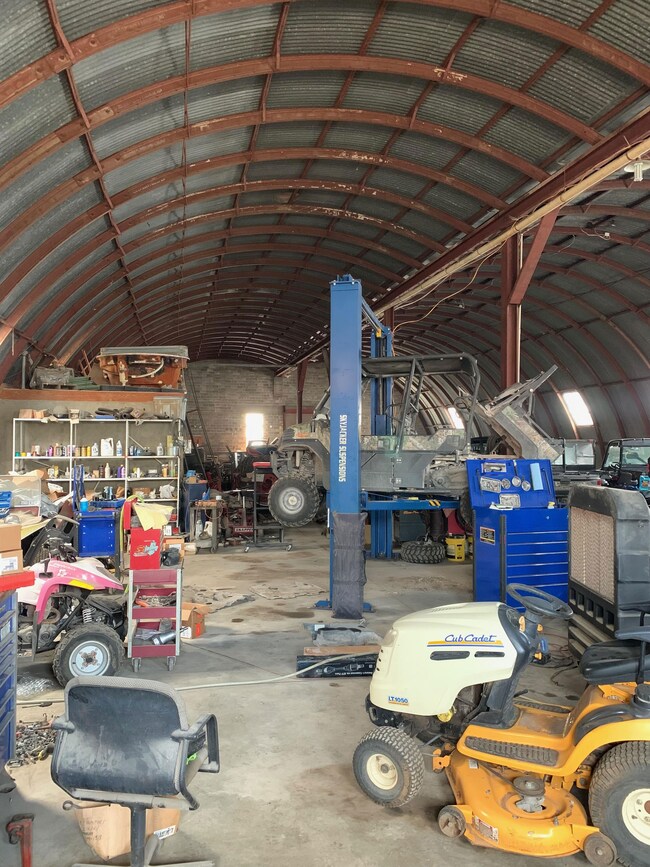
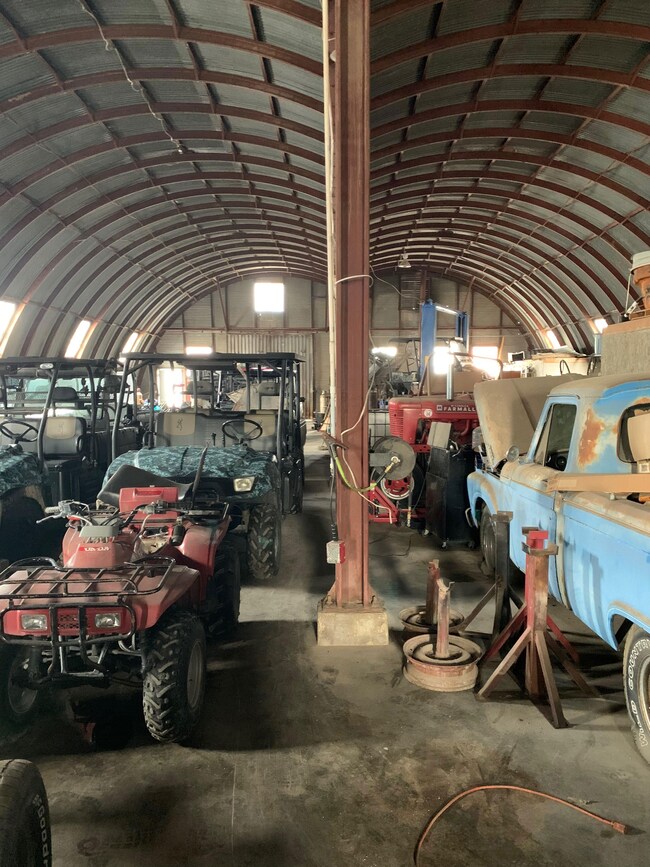
About This Lot
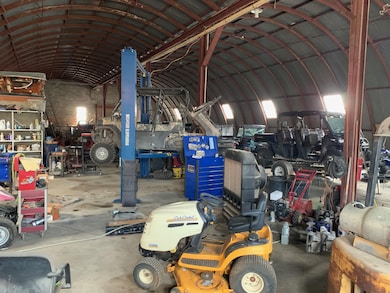
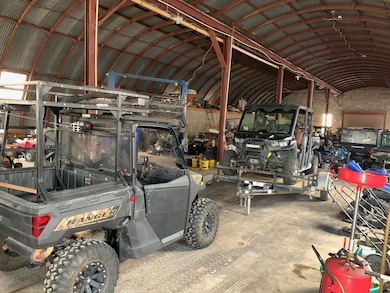
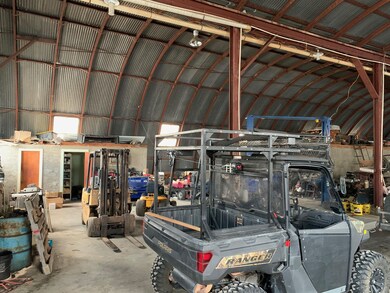
Great commercial space located on US Hwy 183/Fisher St in Goldthwaite. This building is currently being used as a repair shop but could go many different directions! Per MCAD main building area is 6,480 sf with and additional 480 sf in the office. There are also 2 additional rooms and one has a walk in safe. Store front is brick with remainder of building being metal with roll up door and standard door access. Paved alley way runs behind building with double sliding doors and standard door as access into building.
Call today and set up a time to take a look!
Janette Padgett Real Estate, LLC obtains all information from sources deemed reliable. However, no warranty or guarantee is made as to the accuracy of the information. If applicable, Buyers' brokers must be identified on the first contact and must accompany buying prospect on first showing for fee participation. If this condition is not met, fee participation will be at sole discretion of this real estate office.
Listing Agent
Janette Agent
Janette Padgett Real Estate, LLC Listed on: 05/29/2023

Property Details
Property Type
- Land
Est. Annual Taxes
- $1,752
Map
Home Values in the Area
Average Home Value in this Area
Tax History
| Year | Tax Paid | Tax Assessment Tax Assessment Total Assessment is a certain percentage of the fair market value that is determined by local assessors to be the total taxable value of land and additions on the property. | Land | Improvement |
|---|---|---|---|---|
| 2024 | $1,752 | $117,010 | $16,340 | $100,670 |
| 2023 | $1,115 | $74,340 | $16,340 | $58,000 |
| 2022 | $1,206 | $70,720 | $16,340 | $54,380 |
| 2021 | $1,296 | $65,250 | $10,870 | $54,380 |
| 2020 | $1,268 | $63,450 | $9,070 | $54,380 |
| 2019 | $1,314 | $62,830 | $9,070 | $53,760 |
| 2018 | $1,393 | $62,830 | $9,070 | $53,760 |
| 2017 | $1,247 | $62,830 | $9,070 | $53,760 |
| 2016 | $1,252 | $62,880 | $9,070 | $53,810 |
| 2015 | -- | $62,880 | $9,070 | $53,810 |
| 2014 | -- | $62,880 | $9,070 | $53,810 |
Property History
| Date | Event | Price | List to Sale | Price per Sq Ft |
|---|---|---|---|---|
| 05/29/2023 05/29/23 | For Sale | $299,500 | -- | -- |
Purchase History
| Date | Type | Sale Price | Title Company |
|---|---|---|---|
| Grant Deed | -- | -- |
- 144 S Live Oak Mott
- TBD 213
- 1210 2nd St
- 901 W Front St
- 1211 Hutchings St
- 891 U S 183
- 506 W 2nd St
- TBD1 U S 183
- TBD U S 183
- 3 W Highway 84
- 1608 Fisher St
- 1407 S Maple St
- TBD U S Highway 84 W
- 1310 Hanna Valley Rd
- 705 Commercial
- 708 Barrow St
- 0 Spanish Oak Trail
- 118 Spanish Oak Trail
- 106 Spanish Oak Trail
- 1698 Trent St