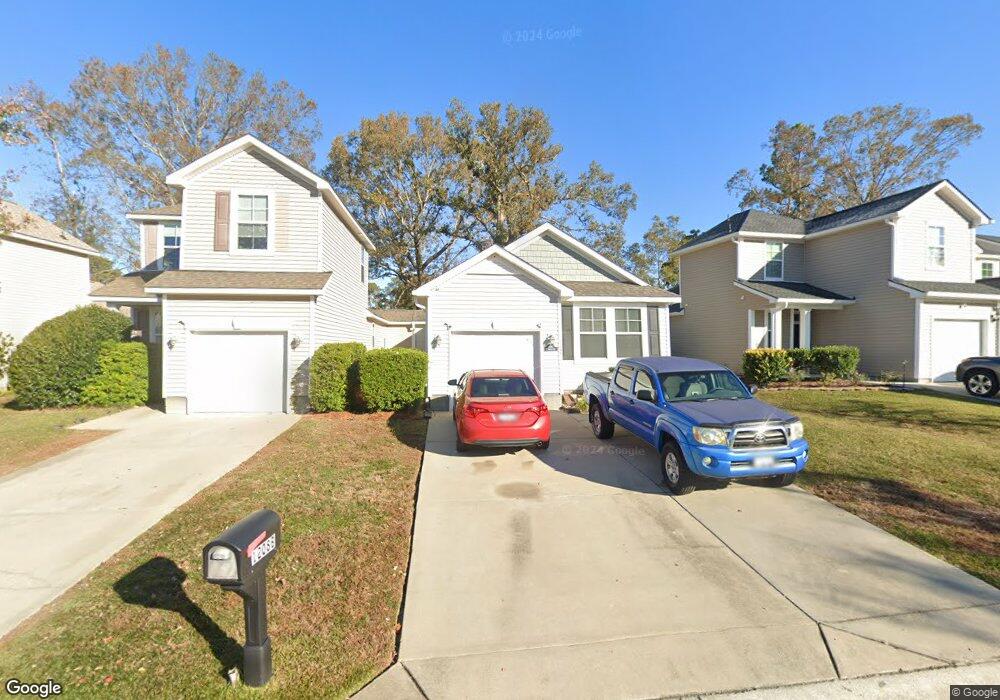
1208 N University Dr Unit B Ladson, SC 29456
Estimated Value: $257,093 - $277,000
3
Beds
2
Baths
1,230
Sq Ft
$216/Sq Ft
Est. Value
About This Home
This home is located at 1208 N University Dr Unit B, Ladson, SC 29456 and is currently estimated at $265,523, approximately $215 per square foot. 1208 N University Dr Unit B is a home located in Berkeley County with nearby schools including College Park Elementary School, College Park Middle School, and Stratford High School.
Ownership History
Date
Name
Owned For
Owner Type
Purchase Details
Closed on
Aug 22, 2014
Sold by
Penport Creekside Llc
Bought by
Scheidt Karl M and Scheidt Heather M
Current Estimated Value
Home Financials for this Owner
Home Financials are based on the most recent Mortgage that was taken out on this home.
Original Mortgage
$131,773
Outstanding Balance
$100,814
Interest Rate
4.2%
Mortgage Type
VA
Estimated Equity
$164,709
Purchase Details
Closed on
Sep 25, 2013
Sold by
Bpms Crowfield Llc
Bought by
Penport Creekside Llc
Purchase Details
Closed on
Sep 13, 2013
Sold by
Bpms Crowfield Llc
Bought by
Penport Creekside Llc
Purchase Details
Closed on
Aug 2, 2005
Sold by
Sharon Investments Llc
Bought by
Bpms Crowfield Llc
Purchase Details
Closed on
Jan 11, 2002
Sold by
Harold Tyner Development Corp
Bought by
Sharon Investments Llc
Create a Home Valuation Report for This Property
The Home Valuation Report is an in-depth analysis detailing your home's value as well as a comparison with similar homes in the area
Home Values in the Area
Average Home Value in this Area
Purchase History
| Date | Buyer | Sale Price | Title Company |
|---|---|---|---|
| Scheidt Karl M | $129,000 | -- | |
| Penport Creekside Llc | -- | -- | |
| Penport Creekside Llc | $207,000 | -- | |
| Bpms Crowfield Llc | $496,000 | -- | |
| Sharon Investments Llc | $210,000 | -- |
Source: Public Records
Mortgage History
| Date | Status | Borrower | Loan Amount |
|---|---|---|---|
| Open | Scheidt Karl M | $131,773 |
Source: Public Records
Tax History Compared to Growth
Tax History
| Year | Tax Paid | Tax Assessment Tax Assessment Total Assessment is a certain percentage of the fair market value that is determined by local assessors to be the total taxable value of land and additions on the property. | Land | Improvement |
|---|---|---|---|---|
| 2025 | $727 | $159,758 | $30,156 | $129,602 |
| 2024 | $727 | $6,390 | $1,206 | $5,184 |
| 2023 | $727 | $6,390 | $1,206 | $5,184 |
| 2022 | $730 | $5,557 | $687 | $4,870 |
| 2021 | $747 | $5,560 | $687 | $4,870 |
| 2020 | $756 | $5,557 | $687 | $4,870 |
| 2019 | $751 | $5,557 | $687 | $4,870 |
| 2018 | $692 | $4,832 | $400 | $4,432 |
| 2017 | $692 | $4,832 | $400 | $4,432 |
| 2016 | $742 | $4,830 | $400 | $4,430 |
| 2015 | $648 | $4,730 | $300 | $4,430 |
| 2014 | -- | $0 | $0 | $0 |
| 2013 | -- | $0 | $0 | $0 |
Source: Public Records
Map
Nearby Homes
- 607 Piedmont Ln
- 75 University Dr
- 402 Miami St Unit A
- 101 Ohio Way
- 352 Oxford Rd
- 425 Miami St Unit A
- 172 Thousand Oaks Cir
- 212 Columbia Dr
- 1086 Briar Rose Ln
- 380 Furman Ln
- 126 Thousand Oaks Cir
- 4042 Exploration Rd
- 201 Two Hitch Rd
- 2045 Cripplecreek Dr
- 104 Thousand Oaks Cir
- 2100 Clipstone Dr
- 2086 Clipstone Dr
- 120 Persimmon Cir
- 208 Darcy Ave
- 1273 Discovery Dr
- 1206 N University Dr Unit A
- 1206 N University Dr Unit B
- 1210 N University Dr Unit B
- 1210 N University Dr Unit A
- 1204 N University Dr Unit B
- 1204 N University Dr Unit A
- 501 Savannah Rd
- 503 Savannah Rd
- 1212 N University Dr Unit A
- 1212 N University Dr Unit B
- 1207 N University Dr Unit B
- 1207 N University Dr Unit A
- 1209 N University Dr Unit B
- 1209 N University Dr Unit A
- 1205 N University Dr Unit B
- 1205 N University Dr Unit A
- 1211 N University Dr Unit A
- 1211 N University Dr
- 1211 N University Dr Unit B
- 1203 N University Dr Unit B